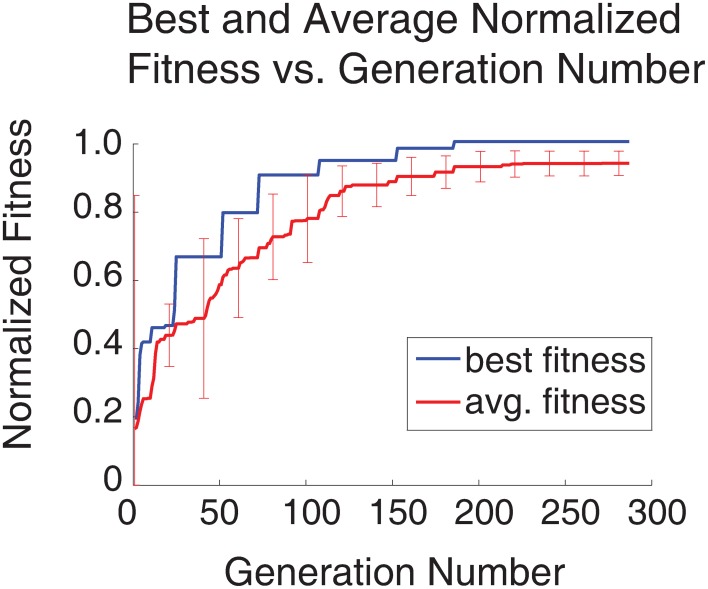
Figure 4.
Plot of best and average fitness vs. generation number for entire simulation run (287 generations, 4104 neuron SNNs, 10 parallel configurations). All values were normalized to the best fitness value. The error bars denote the standard deviation for the average fitness at intervals of once per 20 generations. Initially the standard deviation of the average fitness is large as the EA explores the parameter space, but over time, the standard deviation decreases as the EA finds better solutions.

