
Table 2.
Sorted fitness values (higher is better) for the initial and final SNN populations.
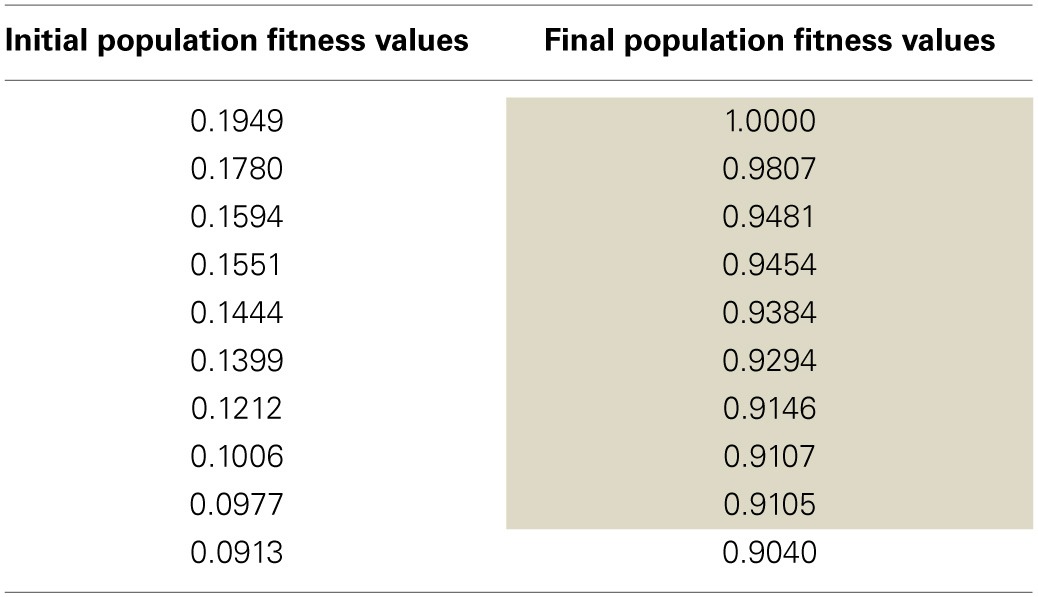
Entries with a shaded background denote SNNs with V1 simple cell responses and SORF formation for every Exc group neuron (4).
Official websites use .gov
A
.gov website belongs to an official
government organization in the United States.
Secure .gov websites use HTTPS
A lock (
) or https:// means you've safely
connected to the .gov website. Share sensitive
information only on official, secure websites.
Sorted fitness values (higher is better) for the initial and final SNN populations.
Entries with a shaded background denote SNNs with V1 simple cell responses and SORF formation for every Exc group neuron (4).