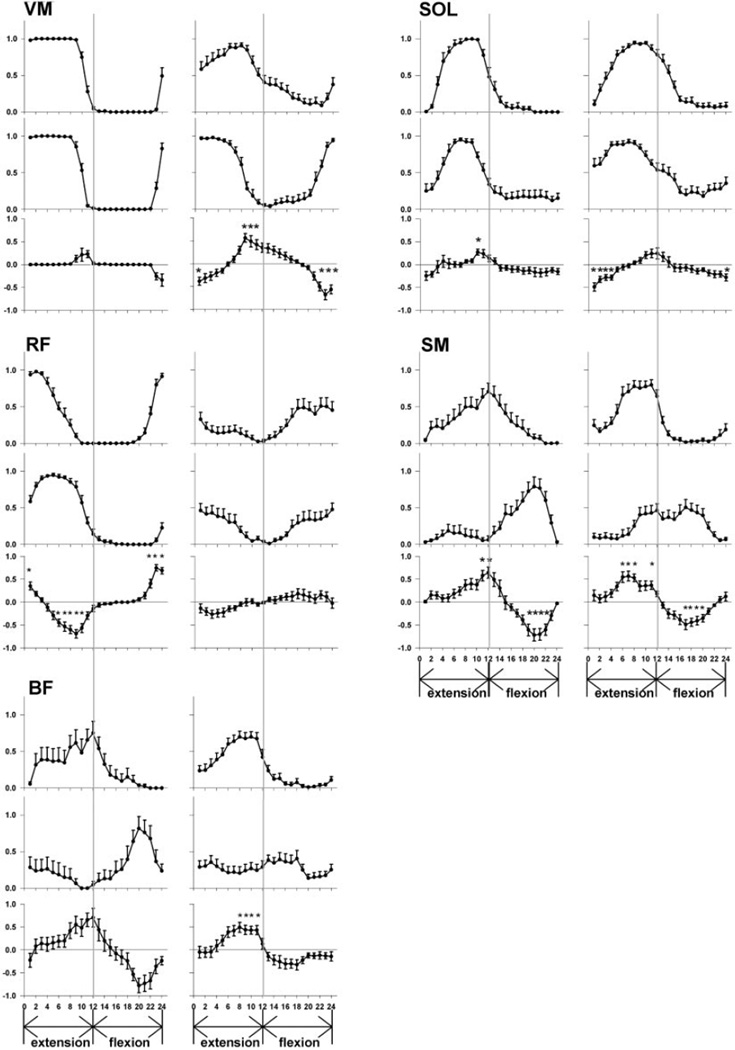
FIG. 5.
Muscle phasing in forward and backward pedaling for the VM, SOL, RF, SM, and BF. Group means for neurologically intact data are on the left, and group means for paretic data are on the right. Figures represent the probability of muscle activity during forward (top) and backward (middle) pedaling. The mean difference between forward and backward probability of muscle activity is on the bottom. The ordinate represents the mean probability of muscle activity, and the abscissa displays the interval of the pedal cycle. Extension and flexion phases of the pedaling cycle are indicate by arrows below the abscissa. The vertical line in the middle of each graph represents the transition point between limb flexion and extension. Error bars are standard error of the mean, and asterisks represent significant within-group differences (P < 0.05, adjusted for multiple comparisons).

