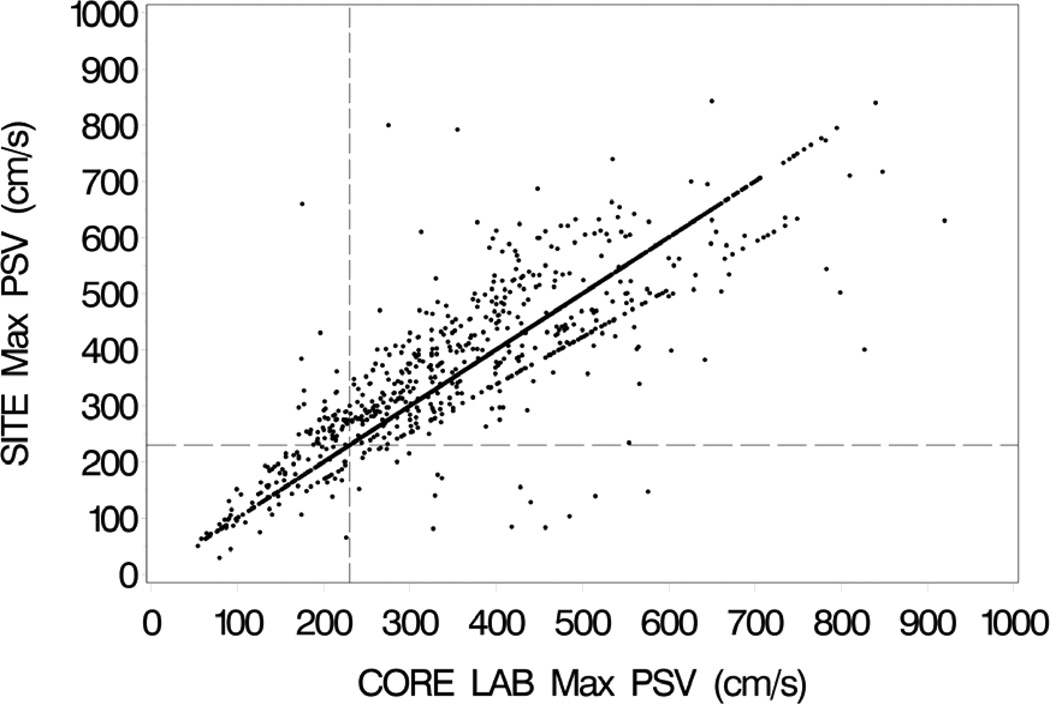
Figure 1.
Clinical site (SITE) maximum peak systolic velocities (PSV) on the vertical axis vs. UCL-verified (CORE LAB) maximum peak systolic velocities on the horizontal axis for the pretreatment baseline duplex scans. Vertical and horizontal dashed lines mark the velocity threshold of 230 cm/s. The concentration of data points along the “line of unity” represents cases where the site PSV value was verified by the UCL and used as the UCL value (correct waveform sample and Doppler angle). The data points forming a line just below the line of unity is an artifact created by using the cosine of 65 degrees for all PSV recalculations involving angles of ≥65 degrees; this was done to avoid very high (non-physiological) calculated PSV values.

