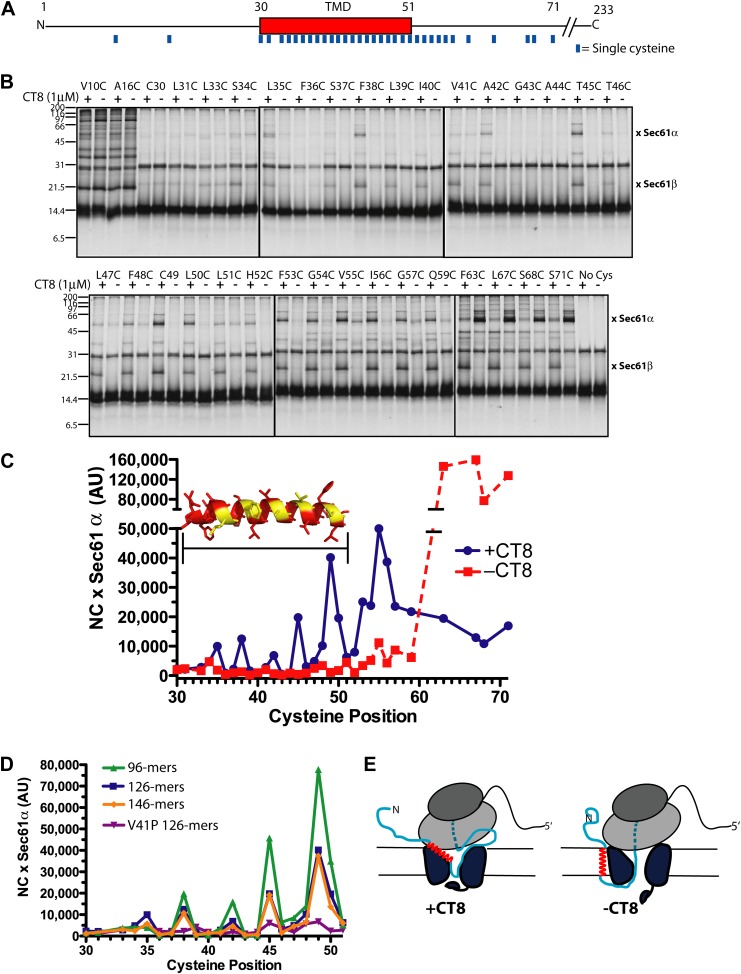
Figure 3. CT8 traps the TMD in a helical conformation with a defined orientation.
(A) Positions of single cysteine mutations (blue dashes) analyzed by BMH crosslinking. (B) BMH crosslinking reactions of 126-mers containing a single cysteine at the indicated positions. (C) Crosslinking intensities (NC × Sec61α) were quantified by phosphorimaging of the gels shown in (B) and plotted as a function of cysteine position. Inset, TMD α-helix model (red) highlighting positions with strongest crosslinks to Sec61α (yellow). (D) Overlay of BMH crosslinking profiles for the indicated constructs. Crosslinking intensities were normalized to an internal standard (Cys49 126-mer) included in each experiment. For raw phosphorimaging data, see Figure 3—figure supplement 1. (E) Cartoon depicting approximate TMD disposition (red) of 126-mer assembled in the presence and absence of CT8.


