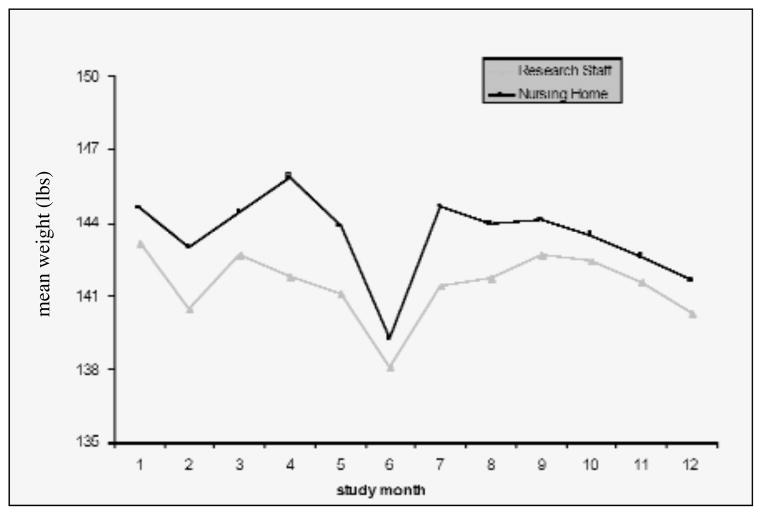
Figure 1.
Difference between Nursing Home and Research Staff Weight Assessments by Study Month (n=90)
Grey line represents research staff weight values. Black line represents Nursing Home staff weight values. X axis represents the twelve study months from month1 to month12. Y axis represents the mean weight in pounds.

