
Fig. 2.
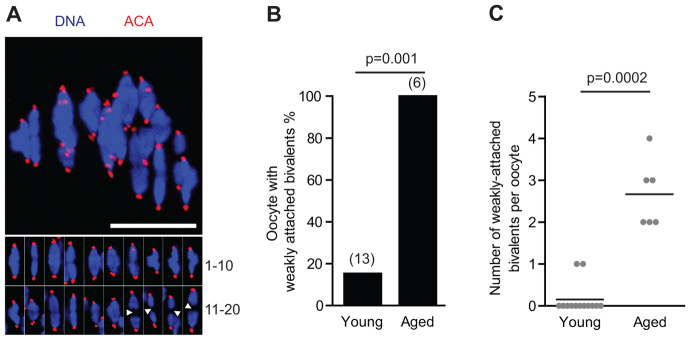
Weakly attached bivalents in aged oocytes. (A) Four weakly attached bivalents in an aged oocyte, marked by arrowheads (inset). (B,C) Percentage of oocytes with weakly attached bivalents (B) and the number present per oocyte (C; the horizontal line indicates the mean). Scale bar: 10 μm. ACA, anti-centromeric antibodies. (B) Fisher’s exact test; (C) Mann-Whitney U.