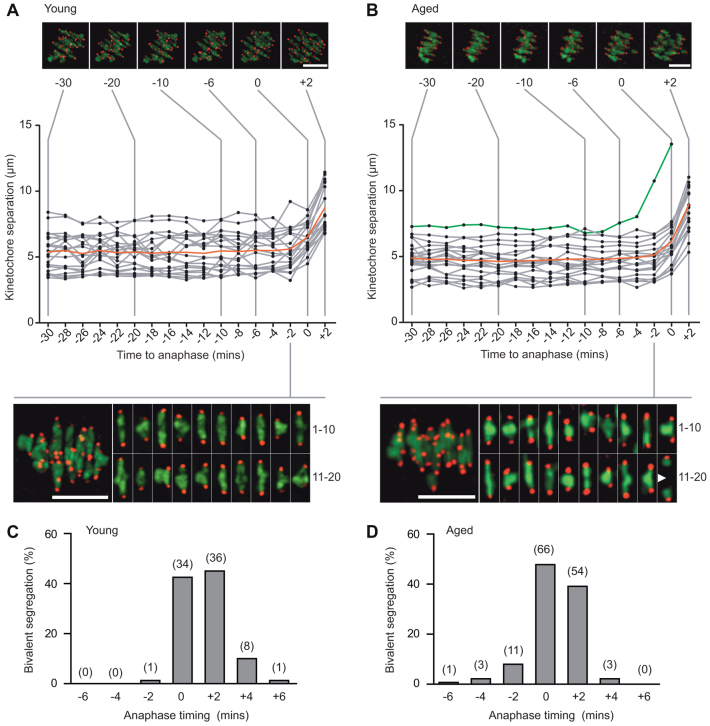
Fig. 5.
In aged oocytes anaphase onset is synchronous. (A,B) Kinetochore separation in a representative young (A) or aged (B) oocyte plotted against time to anaphase onset. Separation is measured as the distance between the two sister kinetochore pairs. Above, selected time points showing a z-projection of bivalents. Below, bivalents in the last frame before anaphase onset. Red lines show the mean value; grey lines show individual values. The green line in B shows tracking of a weakly attached bivalent performing ‘premature but successful separation’ at -4 minutes, marked by the arrowhead in the inset. (C,D) Timing of individual bivalent segregation in young (C) or aged (D) oocytes, relative to the time of the initial increase in mean kinetochore separation (n=12, 4 from young and 8 from aged; 91% counting efficiency of bivalents). In parenthesis, bivalent number. Scale bars: 10 μm.

