
Fig. 6.
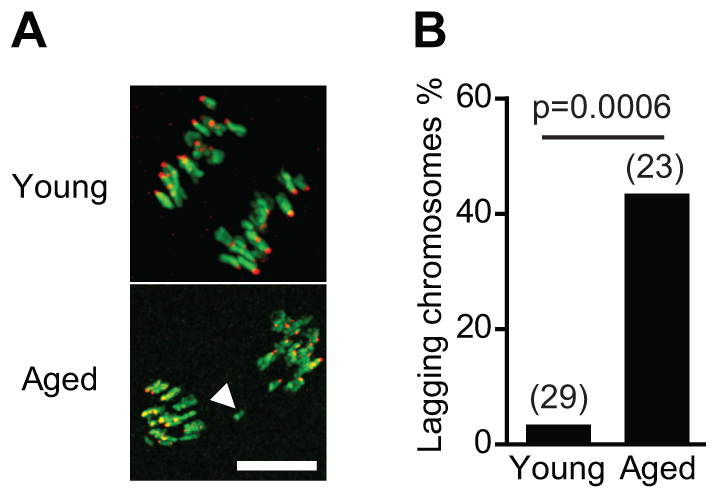
Lagging chromosomes in aged oocytes. (A) Representative images of anaphase in a young and an aged oocyte; the arrowhead shows lagging chromosome. (B) Higher incidence of oocytes with lagging chromosomes at anaphase in aged mice (Fisher’s exact test). The number of oocytes is indicated in parentheses. Scale bar: 10 μm.