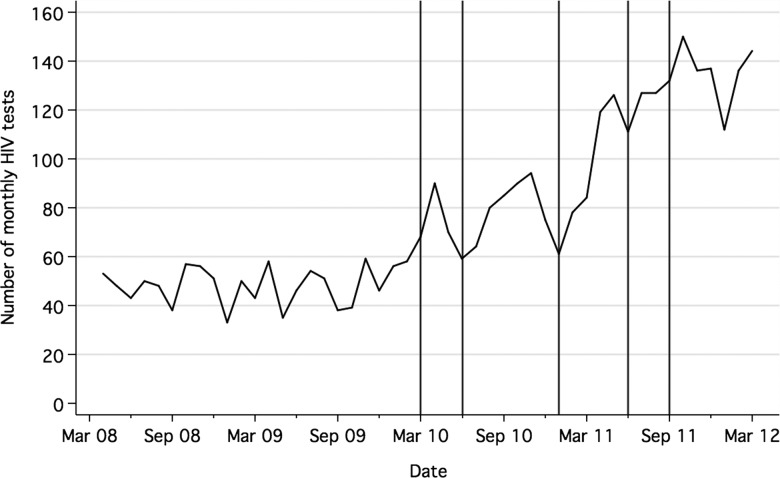
Figure 1.
Training rounds (vertical bars aligned with the start of each training round) and monthly number of HIV tests conducted by Haringey practices (March 2008 to February 2012 plotted at the end of their corresponding month). Data for graph is available in online document ‘figure 1 data’.

