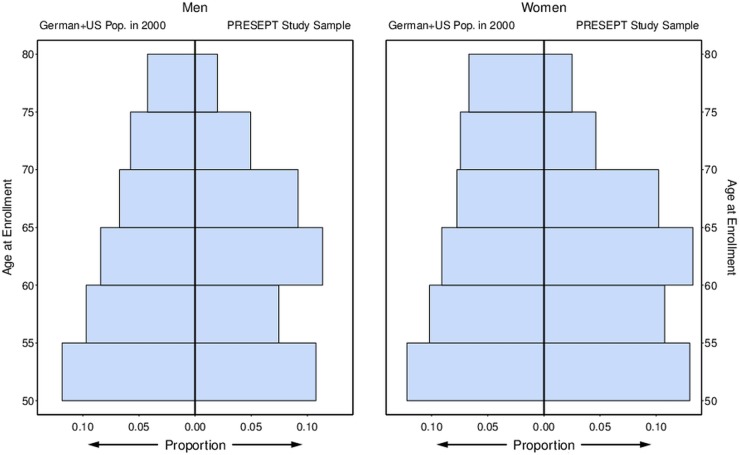
Figure 2.
PRospective Evaluation of SEPT (PRESEPT) results: target population and study subjects, age–sex distribution. Target sample and study sample distributions compared by sex and 5 year intervals of age at enrolment from 50 to 80 years (50–54, 55–59, etc). For the PRESEPT study sample (n=1516), the lowest interval of age (50, 55 years) includes one subject aged <50 years. Similarly, the highest interval (75, 80 years) includes 23 subjects who were aged 80 years or more. Proportions extending to the right in each plot represent proportions of the PRESEPT study sample overall; the sum of all proportions from both plots is 1. Proportions extending to the left in each plot represent proportions of the German and US population in the year 2000.

