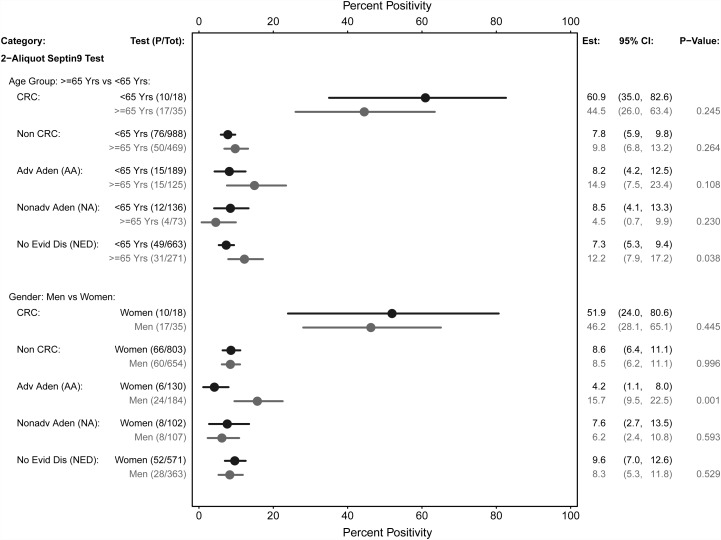
Figure 4.
Methylated SEPT9 (mSEPT9) assay positivity estimates by age, sex and clinical findings. Comparing mSEPT9 assay positivity estimates and 95% CI by age group and outcome category and by sex and outcome category, standardised to the target population. Dot represents point estimate (Est), bars represent 95% CI. AA, advanced adenomas; CRC, colorectal cancer; HGD, high grade dysplasia; NA, non-advanced adenomas; NED, no evidence of disease; Test, raw results of assay; P, number of positive assays; Tot, number of valid measurements.

