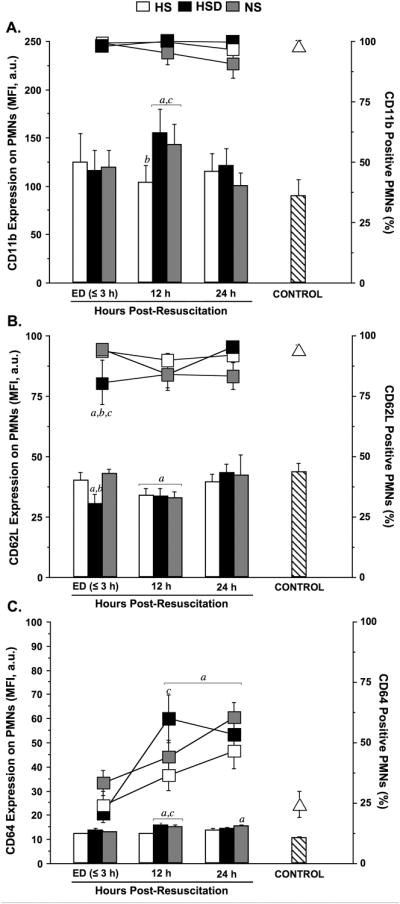
Fig. 2. HS, HSD, and NS differentially modulate neutrophil activation and adhesion molecule expression after TBI.

Cell-surface expression of CD11b (A), CD62L (B), and CD64 (C), were assessed by multiparameter flow cytometry using freshly drawn heparinized whole blood samples. Results were expressed as both the mean fluorescence intensity (MFI, bars) in arbitrary units (a.u.) and percentage antigen-positive (%, lines) neutrophils (PMNs). Blood was sampled serially from patients resuscitated with normal saline (NS; n=39), hypertonic saline-dextran (HSD; n=22), or hypertonic saline (HS; n=22) upon hospital admission (ED ≤3 h) and 12 and 24 h after resuscitation. Blood samples from age and gender matched healthy volunteers served as control (triangles; n=20). Statistical analyses: ap < 0.05 vs. age-matched healthy controls; bp < 0.05 vs. time-matched NS-treated patients; cp < 0.05 vs. time-matched HS-treated patients, by ANOVA.
