
Fig. 3.
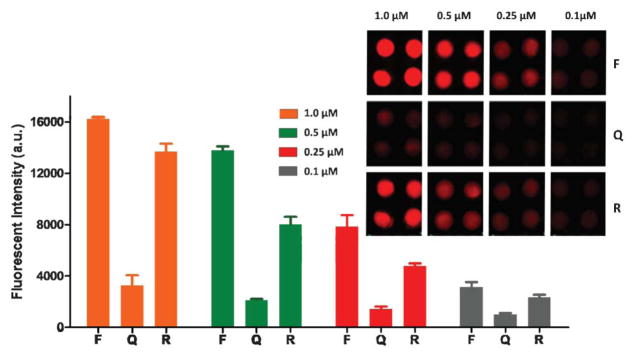
Optimization of the aptamer concentration. The inset is a fluorescence image of different concentrations of the aptamer for L. acidophilus (150.0 cfu mL−1) before quenching (F), after quenching (Q), and after fluorescence recovery (R).
Official websites use .gov
A
.gov website belongs to an official
government organization in the United States.
Secure .gov websites use HTTPS
A lock (
) or https:// means you've safely
connected to the .gov website. Share sensitive
information only on official, secure websites.
Optimization of the aptamer concentration. The inset is a fluorescence image of different concentrations of the aptamer for L. acidophilus (150.0 cfu mL−1) before quenching (F), after quenching (Q), and after fluorescence recovery (R).