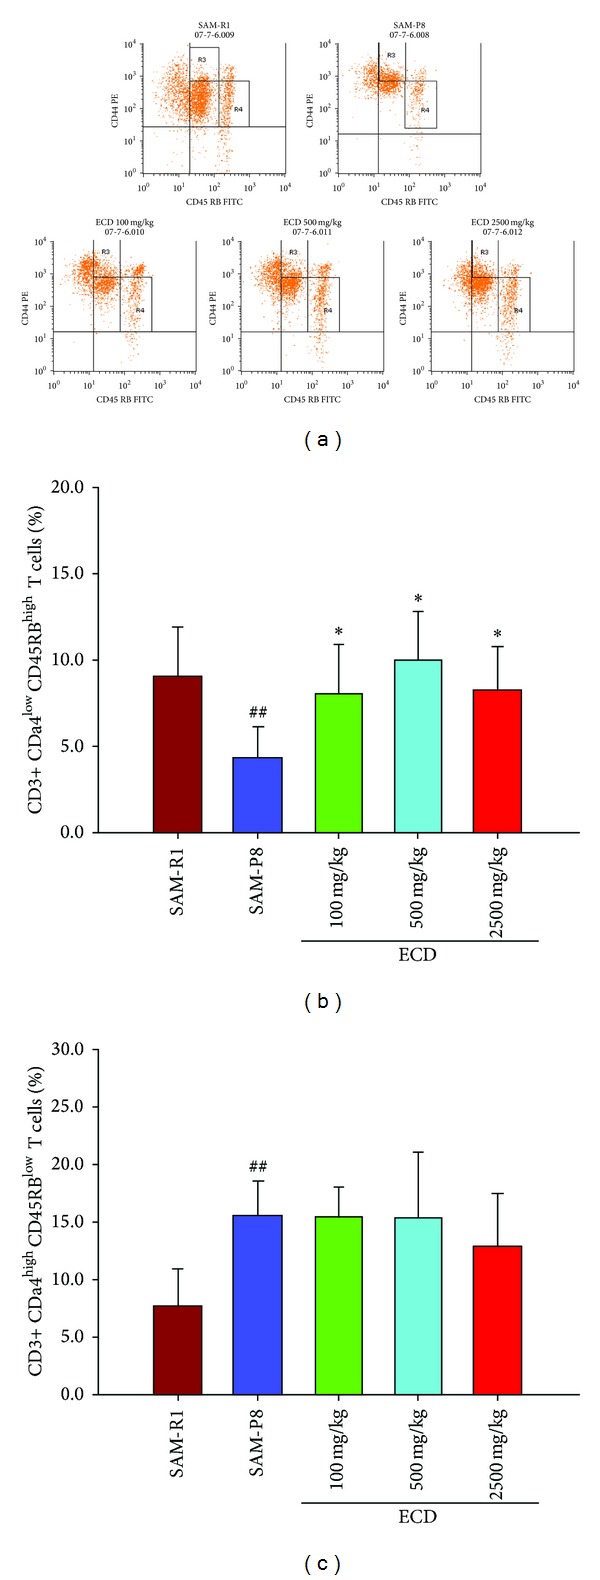
Figure 3.

FACS analysis of the effect of dietary supplementation with ECD on naive and memory T lymphocytes in spleen. Eight-month-old male SAM-P8 and control SAM-R1 mice were divided into 5 groups. The 3 treatment groups of SAM-P8 animals were fed for four weeks with diets supplemented with low (100 mg/kg), medium (500 mg/kg), and high (2500 mg/kg) doses of ECD and the two control animal groups were fed on the same diet without supplementation. Following fasting for 12 hours, splenic lymphocytes were collected from anesthetized animals and subjected to FACS analysis all as described in Section 2. (a) Representative FACS plots of the different groups of mice generated by gating on CD3+ T cells. The lines shown on each plot indicate the thresholds used to distinguish CD44high and CD45RBlow T cell subsets used to allow identification of naive (CD3+ CD44lowCD45RBhigh) and memory (CD3+ CD44highCD45RBlow) T cells. (b) Histogram showing the percentage of naive T cells in splenic lymphocytes of the different animal groups. (c) Histogram showing the percentage of memory T cells in splenic lymphocytes of the different animal groups. Bars represent the mean ± SD (in each group, n = 10). ## P < 0.01 SAM-P8 versus SAM-R1; *P < 0.05 each treated group versus SAM-P8 group (by one way ANOVA with post hoc test).
