
FIG 1:
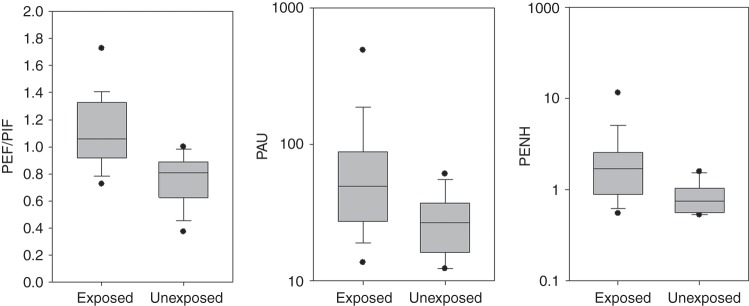
Ratio of peak expiratory to inspiratory flows (PEF/PIF), pause (PAU) and enhanced pause (PENH) in dogs with respiratory diseases exposed and unexposed to tobacco smoke. Solid horizontal bars represent median values and boxes represent the 25th–75th percentiles. Whiskers represent the 5th–95th percentiles and outliers are indicated by black dots. There are significant differences among the two groups in PEF/PIF (P<0.001), PAU (P=0.043) and PENH (P=0.002)