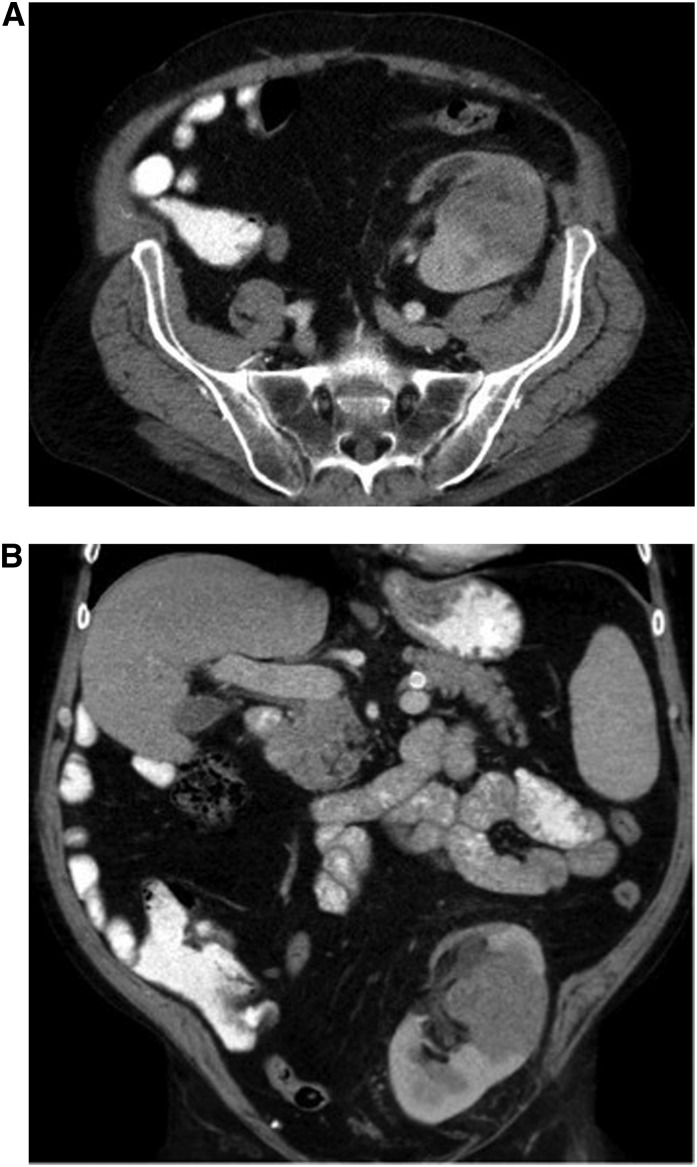
Figure 6.
Computed tomography images of a patient 2 years after transplantation. The patient presented with hematuria, rising creatinine level, and pain over the graft. Transverse (A) and coronal (B) images show a soft tissue mass centered at the midpole of the transplanted kidney, which is heterogeneous in attenuation and measures 6.0 cm × 5.4 cm × 7.0 cm, extending from the lateral cortex to the renal hilum. The remainder of the transplanted kidney is uniformly enhancing with intravenous contrast agent. Biopsy showed post-transplant lymphoproliferative disease.

