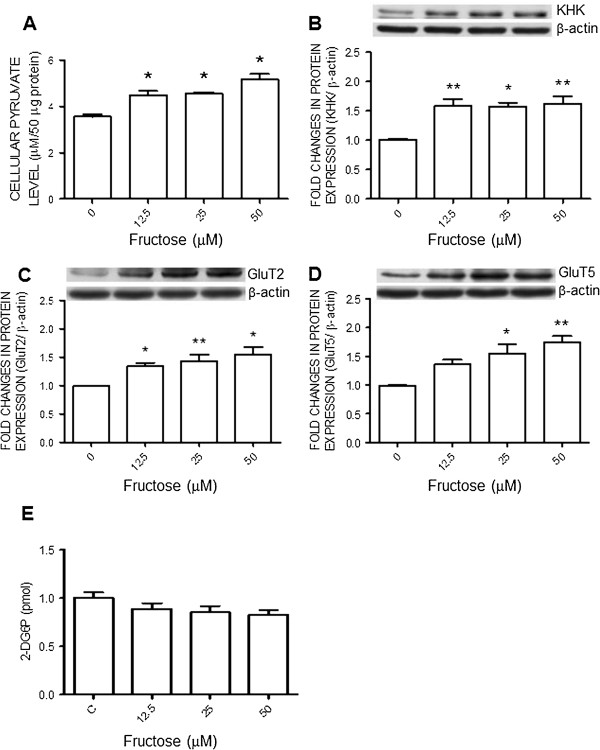
Figure 6.
Fructose upregulates the expression of ketohexokinase and glucose transporters in the N2A cells. Cellular levels of pyruvate (A) and 2-deoxyglucose 6-phosphate (2-DG6P) (E), or representative gels (inset) and densitometric analysis of results from Western blot showing changes in expression of KHK (B), GluT2 (C) or GluT5 (D), examined at 72 hours after the administration of different concentrations of fructose (0, 12.5, 25, or 50 μM) to the N2a cells. Values are mean ± SEM of quadruplicate analyses. *P < 0.05, **P < 0.01 versus control (0 μM fructose) group in the post hoc Tukey’s multiple range test.

