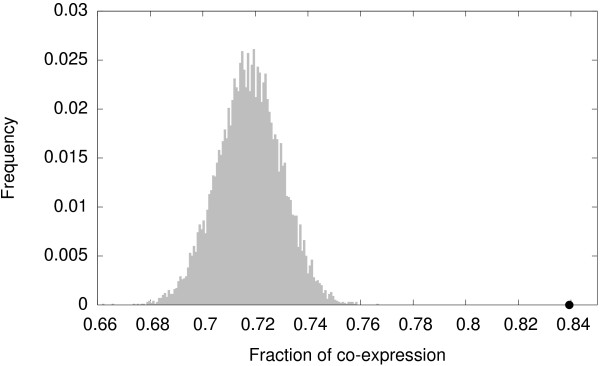
Figure 5.

The fraction of co-expression in the MADSexp network is higher for tetramer-like subgraphs than for random ensembles of subgraphs. We define the fraction of co-expression as the proportion of subgraphs composed of proteins whose genes are expressed jointly in at least one tissue. The black dot indicates the fraction of co-expression for tetramer-like subgraphs (0.84). The histogram represents the frequency distribution of the fraction of co-expression for a sample of 104 ensembles, each composed of 1351 4-node subgraphs picked randomly from the MADSexp network.
