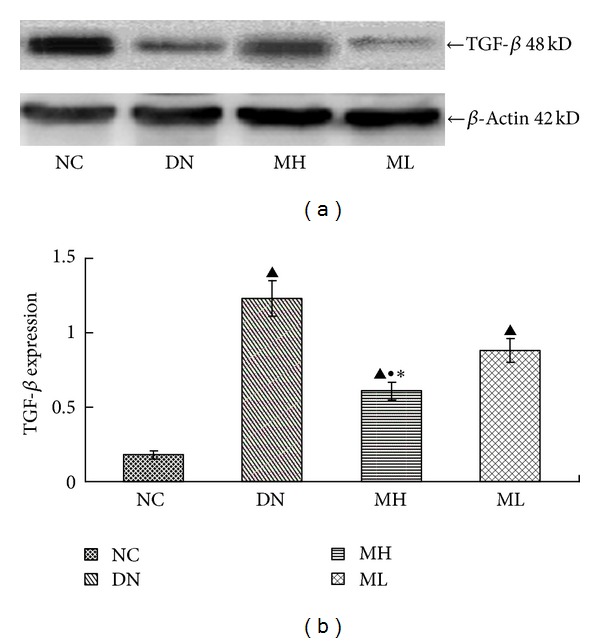
Figure 4.

Expression of TGF-β protein in each group by Western blot. (a) Western blot strip chart. (b) The gray graph shows the relative statistical values of TGF-β for each group. Compared with the NC group, TGF-β expression increased in the experimental groups, especially in the diabetic nephropathy group, with a subsequent decrease upon MG132 treatment, and a more pronounced, significant decrease in the MH group.
