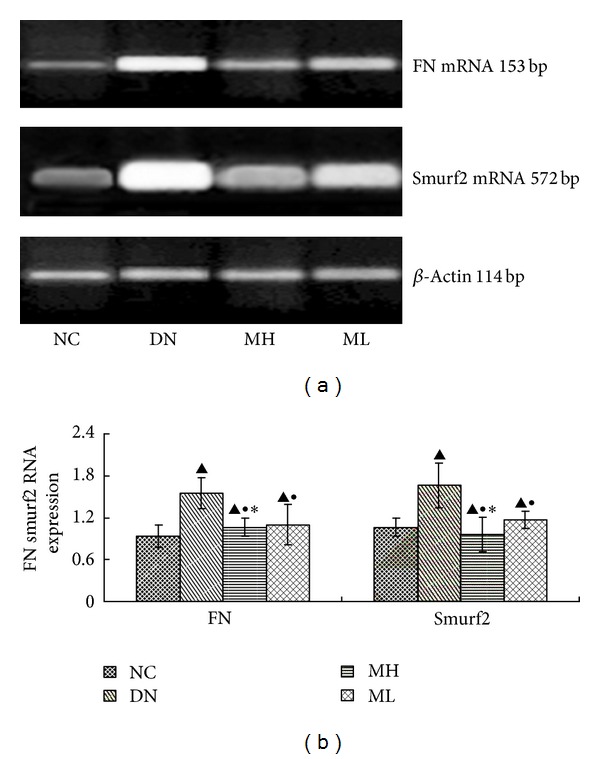
Figure 5.

FN and Smurf2 mRNA levels by real-time fluorescent quantitative PCR in each group. (a) RT-PCR strip chart. (b) The gray graph shows the relative statistical values of the mRNA levels. Compared with the NC group, the levels of FN mRNA and Smurf2 mRNA increased in each experimental group, especially in the diabetic nephropathy group, but subsequently decreased in the MH and ML groups compared with the diabetic nephropathy group, with a more significant decrease in the MH group compared with the ML group.
