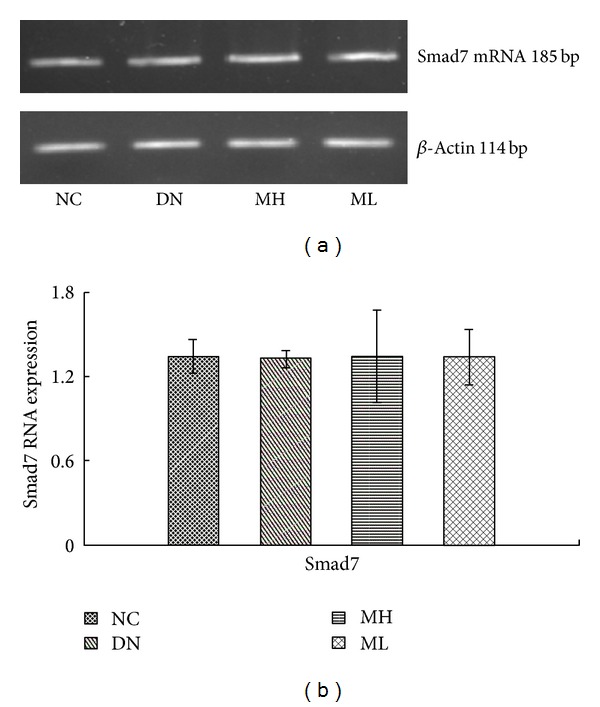
Figure 6.

Smad7 mRNA levels by Real-Time fluorescent quantitative PCR in each group. (a) RT-PCR strip chart. (b) The gray graph shows the relative statistical values of the mRNA levels. There was not significant change of Smad7 mRNA levels in the different group.
