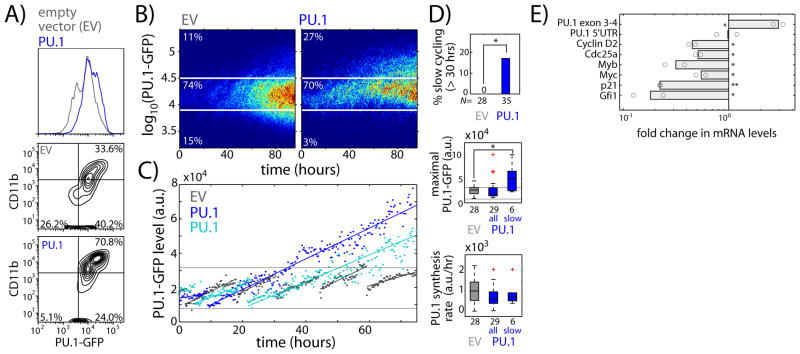
Fig. 3. PU.1 up-regulates its own expression during macrophage development by inducing cell-cycle lengthening.
FLPs transduced with EV or PU.1 retroviral constructs were sorted and cultured with multi-lineage supporting cytokines (SCF, IL-3, IL-7, Flt3L). A) Histogram showing PU.1-GFP levels (top), and flow plots showing CD11b versus PU.1-GFP levels after four days of culture (bottom). B) Heat maps comparing time evolution of PU.1-GFP levels for imaged EV- or PU.1-transduced cells. C) Representative PU.1-GFP time traces for EV or PU.1-transduced cells, taken from lineage trees shown in Fig. S14. D) Box-plots comparing EV- and PU.1-transduced progenitors, showing percentage of slow dividing cells (top), along with maximal PU.1-GFP levels (middle), and PU.1 synthesis rate (bottom) for both the entire PU.1-transduced progenitor population and slow-dividing progenitors alone. Red crosses indicate outliers. Asterisks indicate significantly different means (% slow dividing, p < 0.05, χ2 test, d.f. = 1; maximal PU.1-GFP, one-tailed t-test, p<0.005). Data are representative of two independent experiments. E) EV or PU.1-transduced FcγR2/3low FLPs were cultured for 2 days, harvested for RNA and analyzed using qRT-PCR. Bar chart shows mRNA level fold change for the indicated genes in PU.1-transduced as compared to EV-transduced cells. Bars represent the means of two independent experiments, and circles represent individual measurements (*-p < 0.1; **-p < 0.01; two-tailed t-test).

