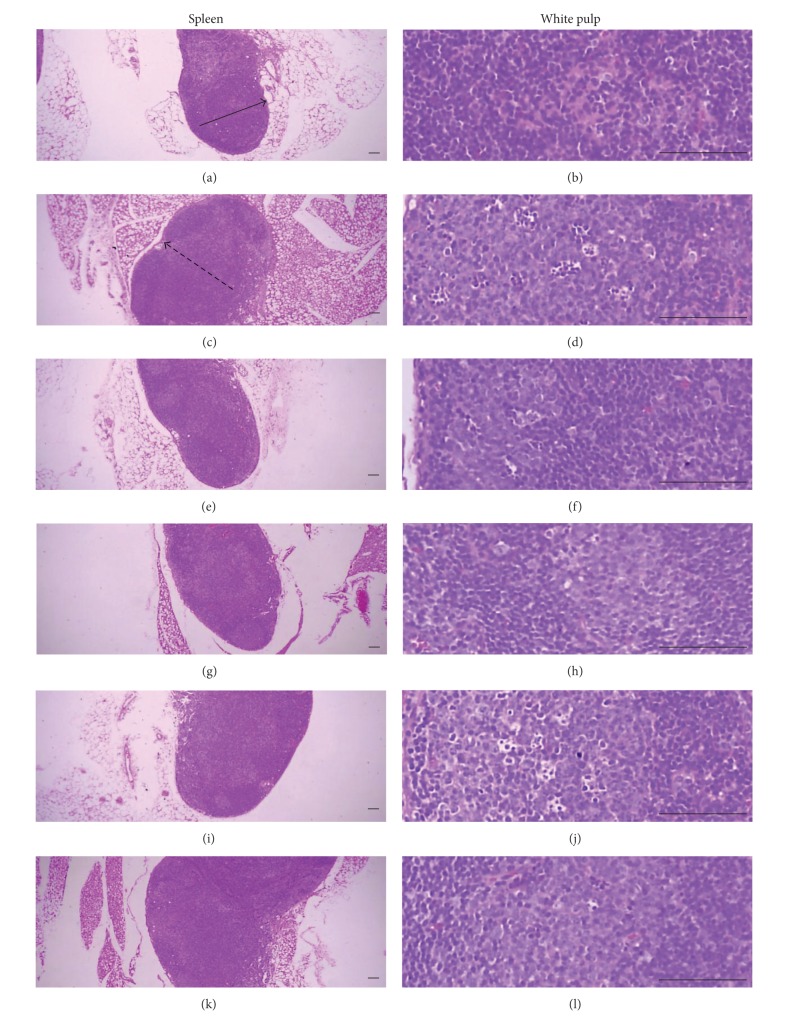
Figure 9.
Histopathological profiles of the left popliteal lymph nodes in the intact control group ((a), (b)), CIA control group ((c), (d)), Enbrel group ((e), (f)), and platycodin D-treated groups; 200 mg/kg ((g), (h)), 100 mg/kg ((i), (j)), and 50 mg/kg ((k), (l)). Marked enlargement of popliteal lymph nodes, related to hyperplasia of lymphoid cells in the cortex of the lymph nodes, was detected in the CIA control mice. However, these histopathological changes decreased dramatically after treatment with Enbrel and all three doses of platycodin D. Arrow indicates the total popliteal lymph node thickness. Doted arrow indicates cortex thicknesses. All were stained with H&E. Scale bars = 160 μm.

