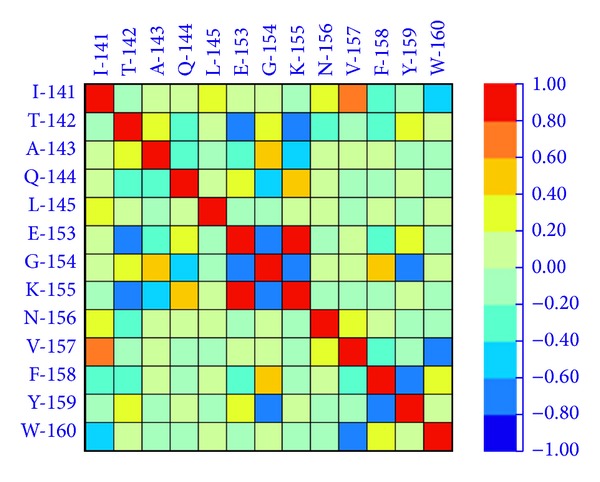
Figure 3.

Pairwise positional correlation estimation of WOX sequences. The pairwise positional correlation estimation was analyzed by CRASP (http://www.bionet.nsc.ru/en). Two regions within the homeodomain, one is from 141 (I) to 145 (L) and the other is from 153 (E) to 160 (W), were closely correlated. The color refers correlation coefficiency of the amino acid at a certain position.
