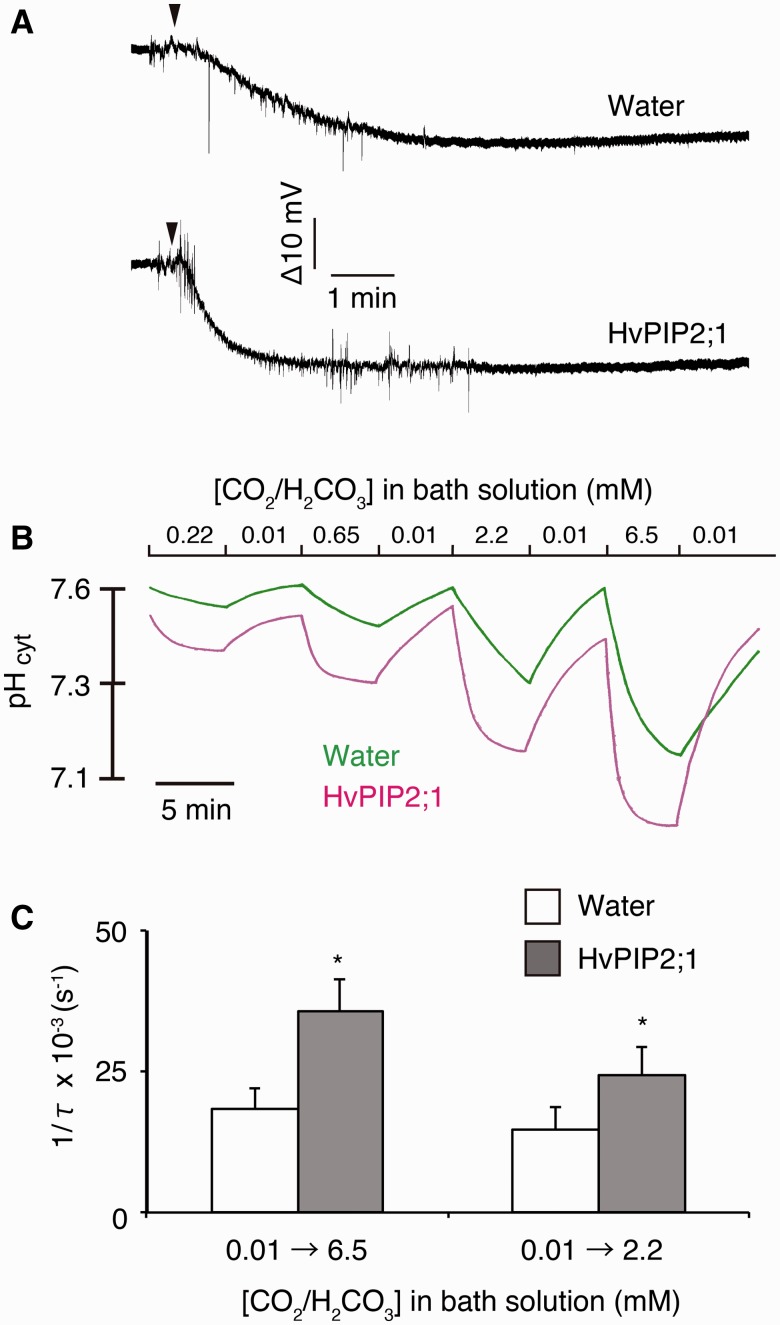
Fig. 1.
Cytosolic acidification of HvPIP2;1-injected X. laevis oocytes induced by perfusion of carbon dioxide-enriched buffer. (A) Typical raw recordings of water-injected and HvPIP2;1 cRNA-injected oocytes by perfusion with modified Barth’s solution, of which the NaCl and NaHCO3 concentrations and pH were modified. The raw recordings represent the difference of the reading of two electrodes (VpH – Vref). VpH and Vref indicate the voltage reading of the hydrogen ion-selective microelectrode and the membrane potential microelectrode, respectively. The pH of the buffer was adjusted to 7.31, so that the ratio of CO2/H2CO3 to  was 0.1. The concentration of CO2/H2CO3 was changed from 0.1 mM to 6.5 mM by perfusion. The perfusion was initiated where indicated by arrowheads. The buffer around the oocyte was replaced 10 s after the start of the perfusion in a typical measurement. This duration was estimation by pH change without an oocyte present. (B) The cytosolic pH change of water-injected (Water, green line) and HvPIP2;1 cRNA-injected (HvPIP2;1, magenta line) oocytes by perfusion with modified Barth’s solution, of which the NaCl and NaHCO3 concentrations and pH were modified. The cytosolic pH was measured by hydrogen ion-selective microelectrodes. In the bath solution with 0.01 mM CO2/H2CO3, NaHCO3 was substituted with NaCl and the concentration of CO2/H2CO3 was determined by equilibration with the ambient air. The bath solutions which included 0.22, 0.65, 2.2 and 6.5 mM CO2/H2CO3 (CO2-enriched buffer) were prepared by replacing NaCl with NaHCO3 to give the appropriate CO2/H2CO3 concentrations in the bath solution. The CO2-enriched buffers were aliquoted and sealed with caps immediately after the preparation to prevent the diffusional loss of CO2 gas into the air. The oocytes were equilibrated to the bath solution containing 0.01 mM CO2/H2CO3 and impaled with the microelectrodes as described in the Materials and Methods. Subsequently, the bath solution was perfused with a peristaltic pump at a rate of 400 µl min−1. Hum noise (60 Hz) was cancelled in silico. Note that the y-axis was converted from electric potential to pH according to calibration lines. A typical calibration line is shown in Supplementary Fig. S6. (C) Rate of cytosolic acidification of water-injected (Water) and HvPIP2;1 cRNA-injected (HvPIP2;1) oocytes as shown by the reciprocal of the time constant (1/τ). The CO2/H2CO3 concentration in the bath solution was replaced by perfusion (400 µl min−1) from 0.01 mM to 6.5 mM (0.01→6.5) or 2.2 mM (0.01→2.2). τ was determined by exponential curve fitting. Water (0.01→6.5), n = 11. HvPIP2;1 (0.01→6.5, n = 10. Water (0.01→2.2), n = 7. HvPIP2;1 (0.01→2.2), n = 6. Asterisks indicate a significant difference of the mean of HvPIP2;1 from that of the water control at α = 0.05.

