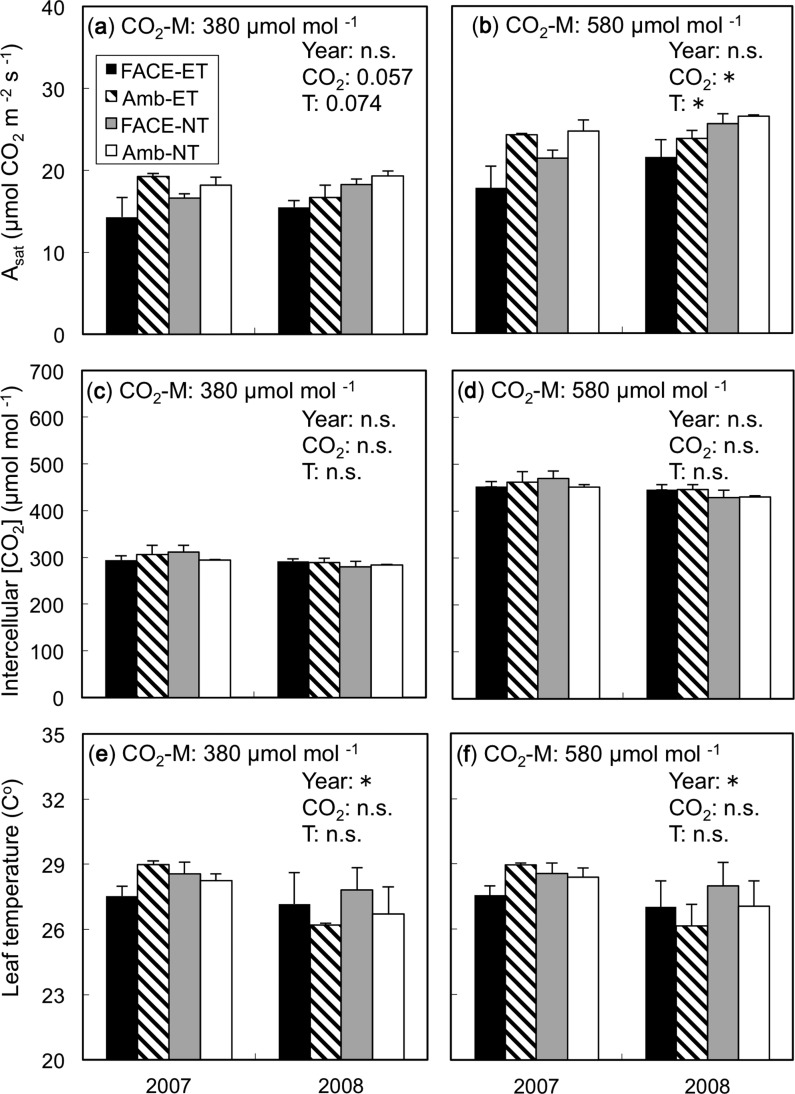
Fig. 2.
Short-term responses of Asat, intercellular [CO2] and leaf temperature measured under a CO2 concentration ([CO2]-M) of (a) 380 and (b) 580 µmol mol−1 at mid-grain filling. Plants were grown at elevated (FACE) or ambient (Amb) [CO2] and elevated (ET) or normal (NT) soil and water temperatures. Asat, intercellular [CO2] and leaf temperature were measured at the same CO2 concentrations ([CO2]-M) regardless of CO2 concentrations during plant growth. For significant results, ANOVA P-values are indicated in each panel (*P < 0.05, n.s., not significant): year as the main plot, growth [CO2] as the split plot, and soil and water temperatures (T) as the split–split plot. Values are the means ± SE (n = 3). No interaction effects were significant.

