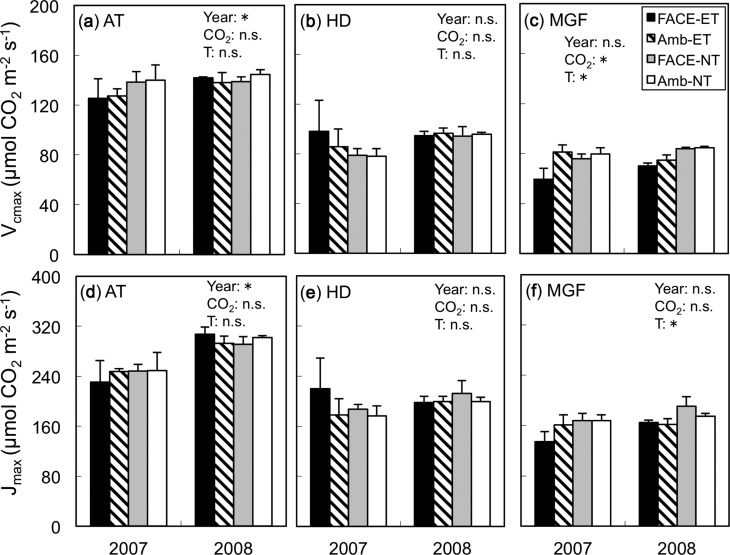
Fig. 3.
The maximum rates of ribulose-1,5-bisphosphate (RuBP) carboxylation (Vcmax) and electron transport driving RuBP regeneration (Jmax) in 2007 and 2008 in the four treatment plots: elevated (FACE) or ambient (Amb) [CO2] and elevated (ET) or normal (NT) soil and water temperatures at three growth stages (AT, active tillerling; HD, heading; and MGF, mid-grain filling). For significant results, ANOVA P-values are indicated in each panel (*P < 0.05, n.s., not significant): year as the main plot, [CO2] as the split plot, and soil and water temperatures (T) as the split–split plot. Values are the means ± SE (n = 3).

