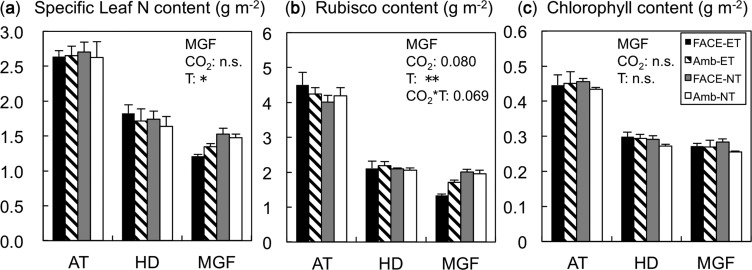
Fig. 4.
Specific leaf N (a), Rubisco (b) and Chl (c) contents on a leaf area basis in the four treatment plots at three growth stages (AT, active tillerling; HD, heading; and MGF, mid-grain filling) in 2008. The 2008 data are shown because all three measurements were made in 2008 only. In 2007, Rubisco and Chl contents were measured, and the results were similar to those in 2008. For significant results, ANOVA P-values at mid-grain filling are indicated in each panel (**P < 0.01; *P < 0.05; n.s., not significant): year as the main plot, [CO2] as the split plot, and soil and water temperatures (T) as the split–split plot (n = 3). No interaction effects were significant.

