Fig. 4.
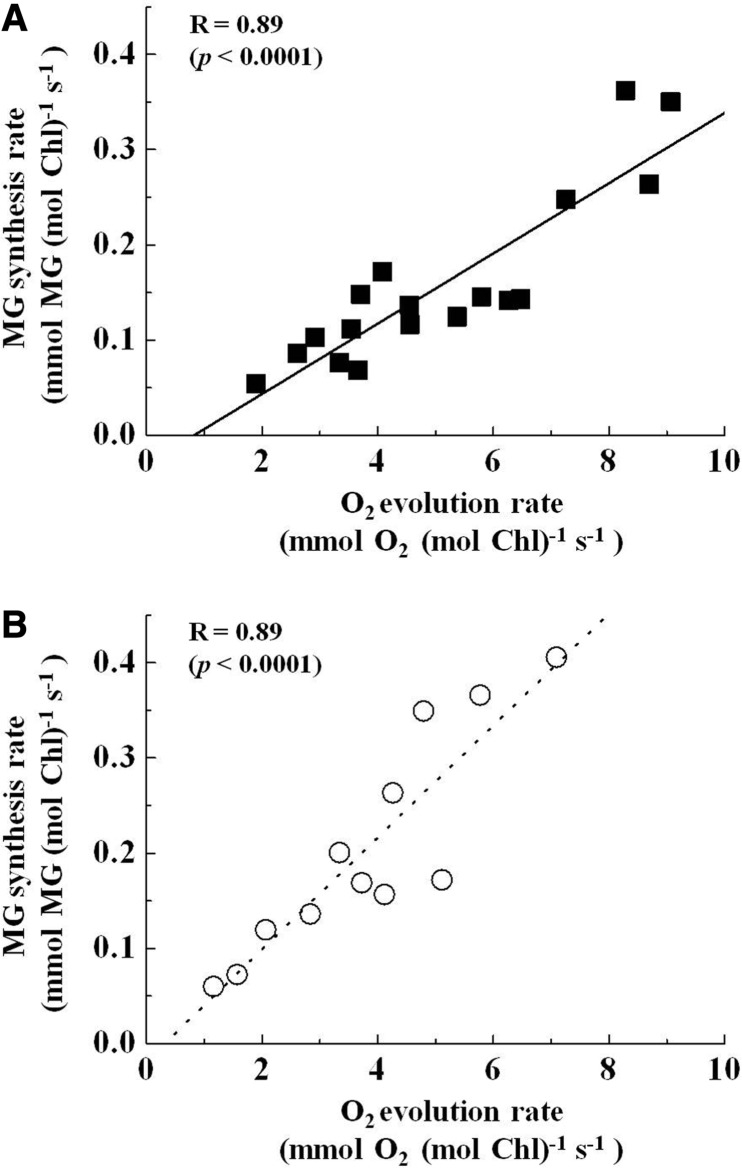
The relationship between the O2 evolution rate and methyglyoxal (MG) synthesis rate. The O2 evolution rate and MG synthesis rate were obtained from Fig. 3. (A) The O2 evolution rates were plotted against the MG synthesis rates. These rates were estimated at 25°C. The positive linear line was the fitted line with the linear regression model. (B) Both the O2 evolution rates and MG synthesis rates were estimated at 35°C (data not shown), and the O2 evolution rates were plotted against the MG synthesis rates. The positive linear dotted line is the line fitted with the linear regression model. The correlation coefficient (R) and P-value are shown. Values were obtained from five independent experiments.

