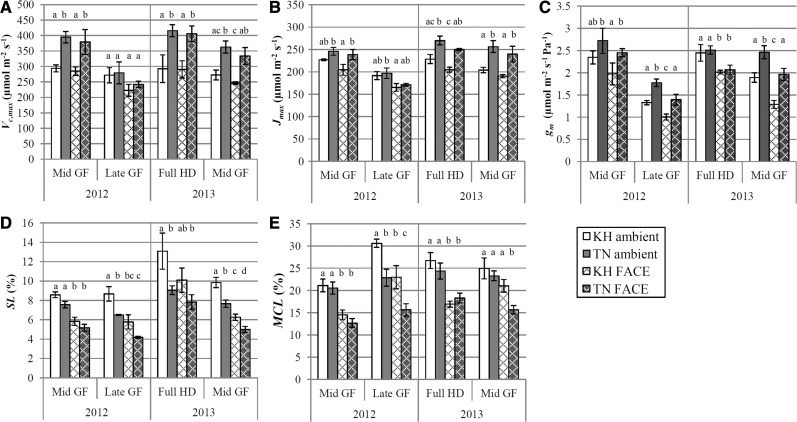
Fig. 2.
Photosynthetic parameters derived from analysis of CO2 response curves of Koshihikari (white bars) and Takanari (gray bars) grown under ambient (plain bars) and FACE (cross-hatched bars) conditions. Data were taken in 2012 at the mid grain filling (GF) (2 weeks after heading) and late GF stage (4 weeks after heading), and in 2013 at full heading (HD) (3 d after heading) and the mid GF stage. All measurements were taken on flag leaves. Error bars are SEMs. Different letters above each bar indicate significant differences between means at α = 0.05 within each measurement time point. n = 4. (A) Maximum carboxylation rate of Rubisco (Vc,max). (B) Maximum electron transport rate (Jmax). (C) Mesophyll conductance to CO2 (gm), expressed in µmol m−2 s−1 Pa−1; when atmospheric pressure is 101.3 kPa, this is nearly equal to 10 times the value of gm expressed in mol m−2 s−1. (D) Stomatal limitation to photosynthesis (SL) at each treatment’s respective growth [CO2]. (E) Mesophyll conductance limitation to photosynthesis (MCL) at each treatment’s respective growth [CO2].

