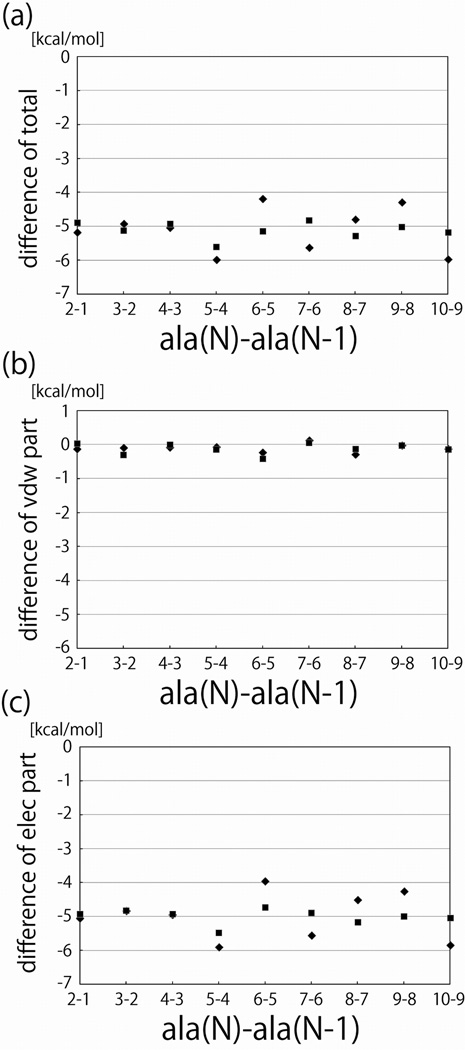
Figure 5.
The differences between the solvation free energies of peptides of length n and those of length n − 1 plotted as functions of n. Squares represent the results of alchemical free energy calculations, and diamonds represent the differences between the free energy estimates computed by thermodynamic integration. a. The total solvation free energy. b. The van der Waal’s (cavity-formation) component of the solvation free energy. c. The electrostatic component of the solvation free energy.

