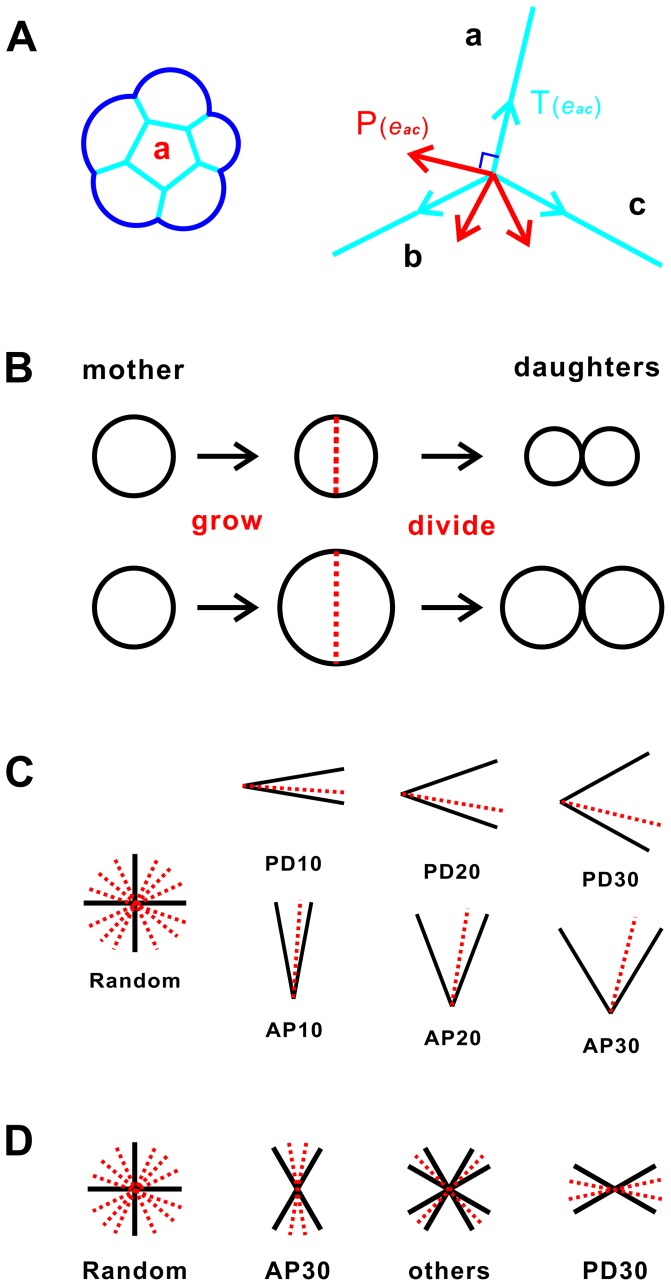
Figure 1. Simulation methodology of cellular model.
(A) Left, cells are presented by geometric elements of cell, edge, and vertex. Right, mechanical forces are modeled as tension (blue) and pressure (red). (B) Growth model of reduced cell size (RCS) and non-RCS. In the RCS model, cells proliferate but do not grow. In the non-RCS model, cells grow and proliferate. (C) Division model of oriented cell divisions (OCD) and non-OCD. In the OCD model, the division plane is chosen from uniform distributions of angles in [−10°, 10°], [−20°, 20°], and [−30°, 30°], with respect to the PD-axis and the AP-axis, respectively. (D) Models for oriented mechanical forces (OMF) and non-OMF. In OMF models, tension coefficient η is set to 0.75, 1.0, and 1.5, when a cell edge is within [0°, 30°] (PD30), [30°, 60°] (others), and [60°, 90°] (AP30) with respect to the PD-axis, respectively.

