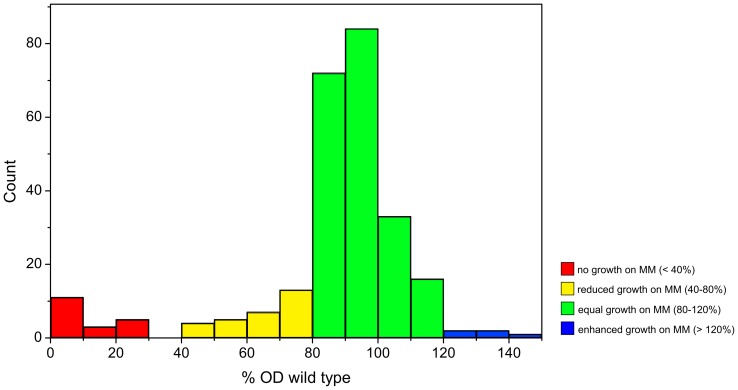
Figure 2. Histogram displaying the relative optical density (% OD) compared to the C. glutamicum wild type.
Measurements were done after 7 hours incubation in glucose minimal medium (MM). Mutants can be divided into 4 groups: no or only minimal growth on MM (red), reduced growth (yellow), equal growth (green) and enhanced growth (blue) compared to the wild type.

