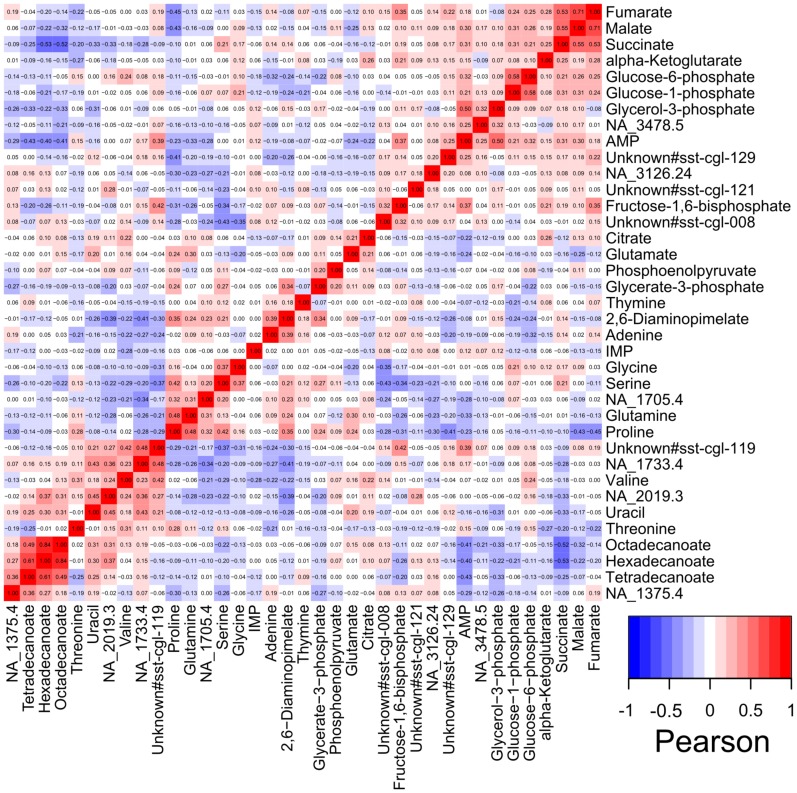
Figure 3. Heatmap of pairwise correlation values of 37 metabolites.
The Pearson correlation coefficients were calculated for log2 transformed ratios of the median values of C. glutamicum mutant and wild type. For a better overview only metabolites with the highest reproducibility (>95%) were displayed.

