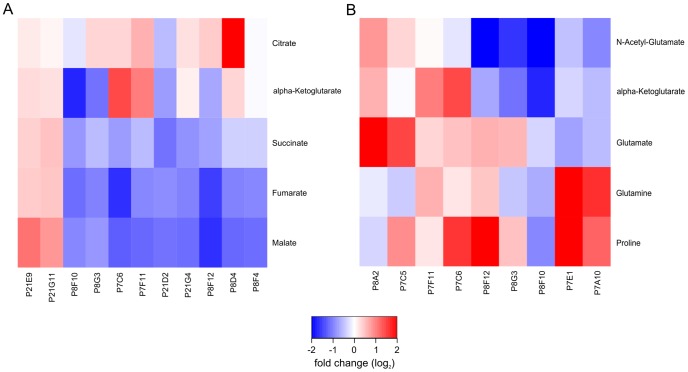
Figure 5. Heatmap showing log2 transformed ratios (mutant/wild type) of metabolites in selected pathways.
Only C. glutamicum mutants with significant changes (p<0.01 Bonferroni corrected) in at least 2 of the selected metabolites were analyzed. A Ratios of metabolites in the TCA cycle. B Ratios of metabolites associated with glutamate.

