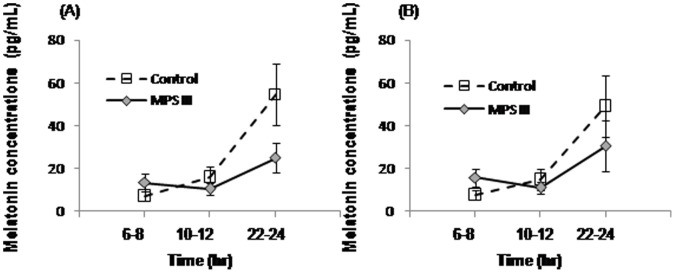
Figure 2. Melatonin concentrations (average ± SEM) in MPS III patients and controls.

Saliva samples were collected at the times shown on. (A) First day of actigraphic monitoring. (B) Last day of actigraphic recording.

Saliva samples were collected at the times shown on. (A) First day of actigraphic monitoring. (B) Last day of actigraphic recording.