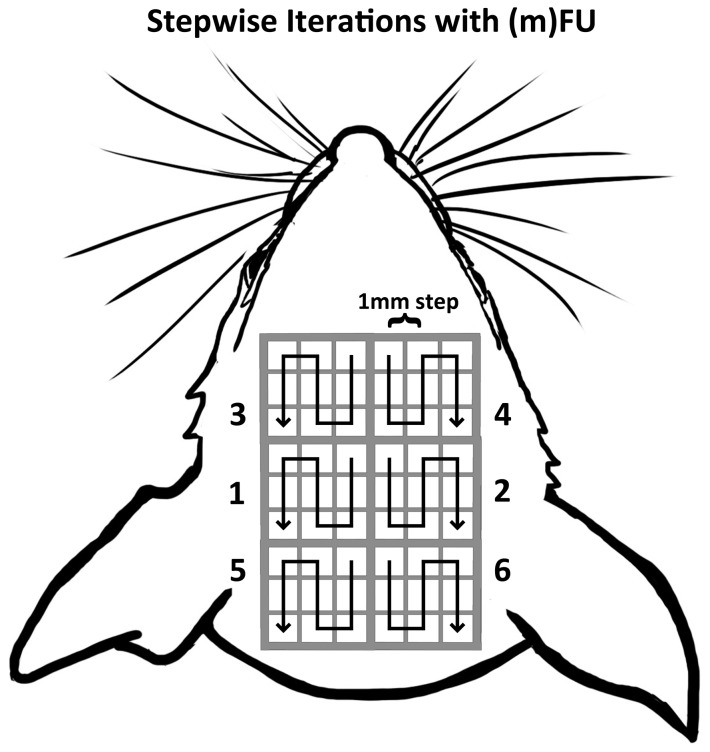
Figure 4. Superficial projection of intra-cranial stimulation regions created by mFU and FUS.
The 54 squares represent the superficial projection of individual, intra-cranial stimulation regions, with centers separated in 1 mm increments. Trials began in region 1 and concluded in region 6, following the arrow within each region.

