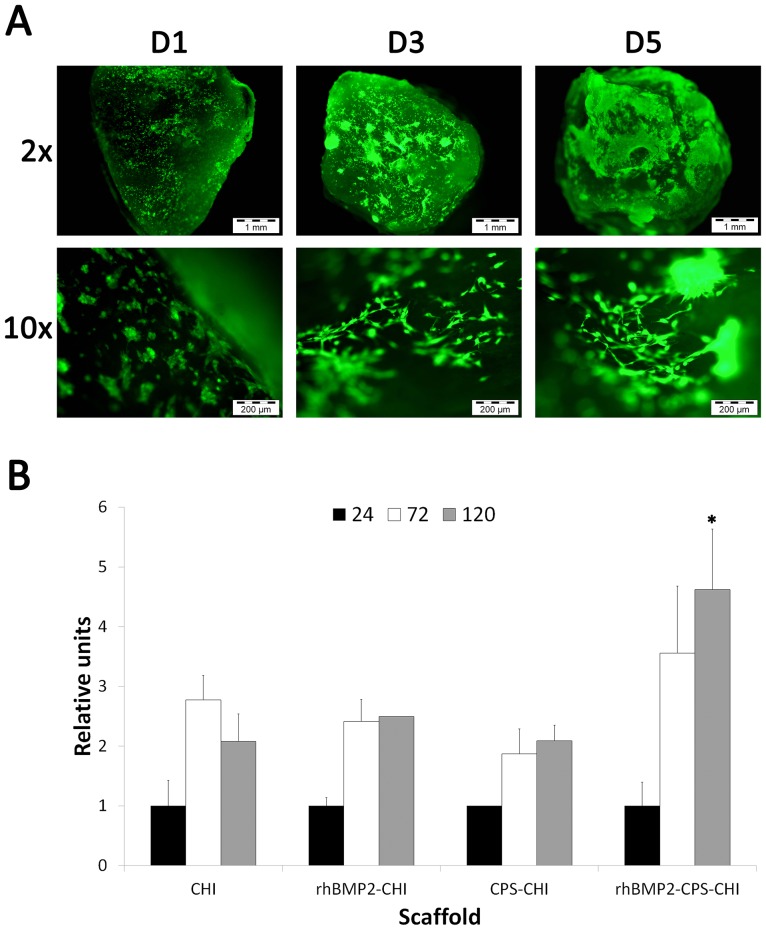
Figure 4. Viability and proliferation assays.
A) Calcein assay: Green fluorescence corresponds to calcein vital staining at day 1 (D1), day 3 (D3) and day 5 (D5). Images show a representative experiment on rhBMP2-CPS-CHI scaffolds; B) Alamar Blue assay: Graph shows a time course quantitative measurement of cell viability for the four scaffolds (CHI, rhBMP2-CHI, CPS-CHI, rhBMP2-CPS-CHI). Relative units are referred to fluorescence units observed at day 1 in order to remark different cell growth between different scaffolds. *P<0.05 comparing with the other scaffolds at the same time point.

