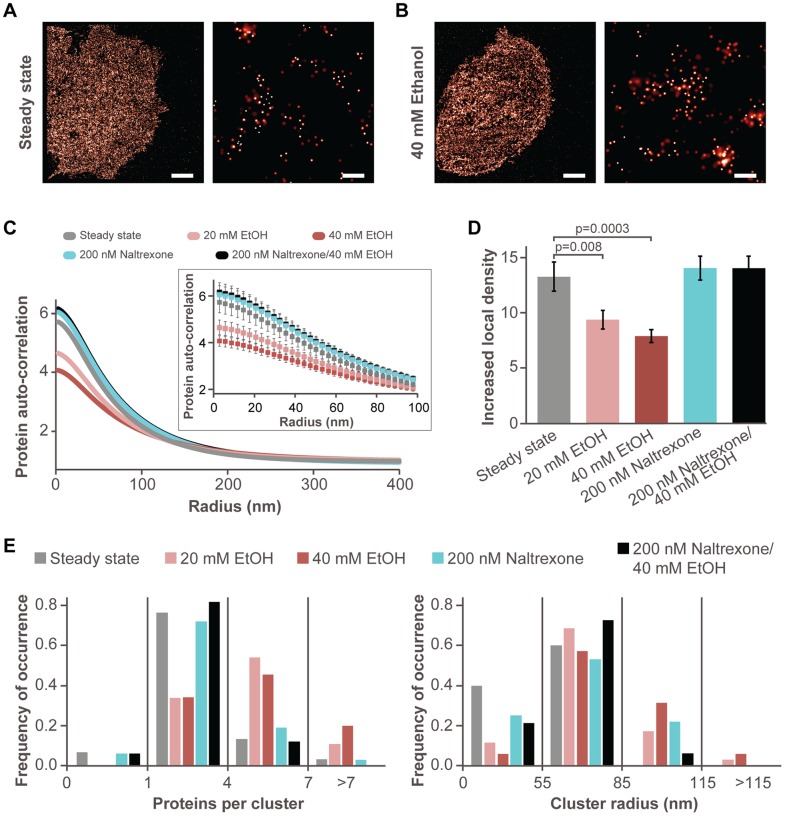
Figure 1. Effect of ethanol and naltrexone on GPI distribution.
A. PALM image of the whole area (left, scale bar 5 µm) and a magnified area (right, scale bar 200 nm) showing GPI distribution in untreated MDA-MB-468 cells (control). B. PALM images of the whole area (left, scale bar 5 µm) and a magnified area (right, scale bar 200 nm) showing GPI distribution in MDA-MB-468 cells incubated with 40 mM ethanol for 20 min. Super-resolution images were generated by analyzing dataset using a standard PALM analysis [25]; peaks were grouped using maximum blinking time of 10 s for paGFP and group radius of 2.5 σ. Centers of peaks for panels A and B are given in Figure S1 in File S1 and Figure S2 in File S1. C. Average protein auto-correlation functions in untreated cells (gray, n = 31), after 20 min incubation in the presence of 20 mM ethanol (pink, n = 36), after 20 min incubation in the presence of 40 mM ethanol (russet, n = 36), upon 20 min incubation with 200 nM naltrexone (cyan, n = 33) and upon 3 h preincubation with 200 nM naltrexone followed subsequently by a 20 min incubation in the presence of 40 mM ethanol (black, n = 34). Insert shows magnified area at shorter radii with s.e.m. D. Increased local density of paGFP-GPI with s.e.m. Ethanol addition significantly decreased local density of GPI compared to that in untreated cells. E. Distribution of paGFP-GPI molecules per cluster (left) and cluster radius (right). Ethanol addition had significant increase in number of detected proteins per cluster and cluster radius compared to steady state, whereas no significant change is observed for other perturbation conditions.

