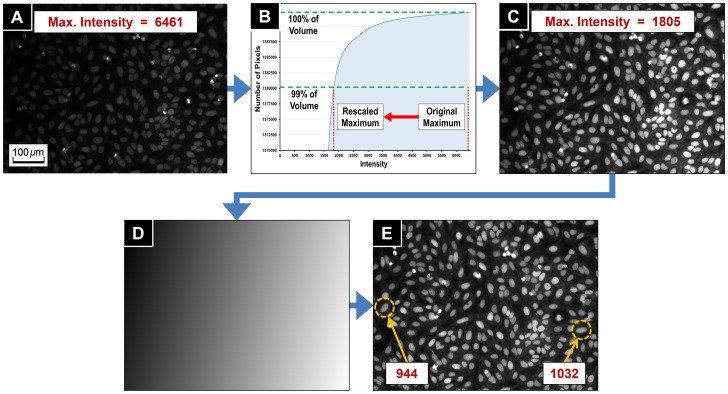
Figure 2. Image enhancement process.
(A) Original image of maximum intensity 6461. (B) Cumulative histogram of intensity. The maximum intensity is rescaled to the intensity of higher 1% cumulative intensity level. (C) Intensity equalized image. The maximum intensity has decreased to 1805. (D) Estimated shading map of (C). (E) Biased illumination was corrected from (C). The numbers in the boxes of (C) and (E) are average intensities of nuclei in the yellow dashed circles.

