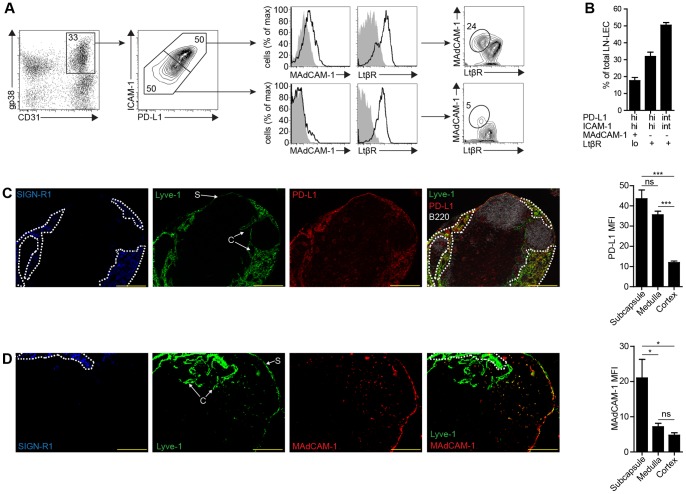
Figure 3. PD-L1 in combination with ICAM-1, MAdCAM-1, and LtβR define distinct LEC subsets that vary in location in the LN.
a. Single cell suspensions of CD45neg LN cells were stained with antibodies against PD-L1, ICAM-1, MAdCAM-1, and LtβR. Number in the gp38 vs. CD31 2-D plot indicates percentage of total CD45neg cells. Number in the 2-D PD-L1 vs. ICAM-1 plot indicates percentage of total LEC. Number in the 2-D MAdCAM-1 vs. LtβR plots indicates percentage of total PD-L1hi ICAM-1hi LEC (top) or PD-L1int ICAM-1int LEC (bottom). b. Summary graph of 7 independent experiments of the indicated LEC subpopulation percentage of total LEC. Data are represented as mean +/− SEM. c, d. Frozen axillary LN sections were stained with antibodies specific for SIGN-R1, PD-L1, Lyve-1, CD31, and B220 (c) or SIGN-R1, MAdCAM-1, and Lyve-1 (d). Dashed line represents regions of SIGN-R1 staining. S = subcapsule, C = cortex. Scale bar = 200 µm. Staining is representative of multiple fields from 3 experiments consisting of 2 separate LN from 3 mice. Graphs represent PD-L1 (c) or MAdCAM-1 (d) MFI gated on Lyve-1+ pixels in the indicated LN compartments. Data are represented as mean +/− SEM. *p<0.05, ***p<0.001, ns = not significant.

