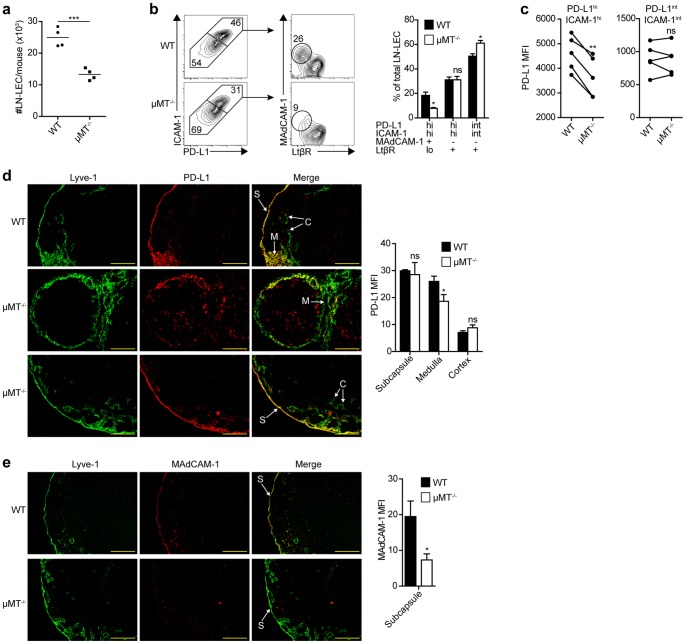
Figure 6. B cells control the representation and PD-L1 expression level of medullary LEC, and MAdCAM-1 expression on subcapsular LEC.
a. LNSC were purified by enzymatic digestion of pooled LN and CD45 magnetic bead separation from µMT−/− or WT mice. LEC absolute number was calculated from cells that were gated as Dapineg, singlets, CD45neg, gp38+, CD31+ cells by flow cytometry. b. LNSC were stained with antibodies specific for gp38, CD31, PD-L1, ICAM-1, MAdCAM-1, and LtβR, and analyzed by flow cytometry. Left panel, plots display data gated on CD45neg gp38+ CD31+ LEC and subsequently gated on PD-L1 and ICAM-1 co-expressing subpopulations. Numbers indicate percentage of gated population out of total LEC (PD-L1 vs. ICAM-1 2-D plots), or out of total PD-L1hi ICAM-1hi or PD-L1int ICAM-1int subpopulations (MAdCAM-1 vs. LtβR 2-D plots). Right panel, summary of 3 independent experiments. Data are represented as mean +/− SEM. c. PD-L1 MFI of PD-L1hi ICAM-1hi and PD-L1int ICAM-1int subpopulations gated on CD45neg gp38+ CD31+ LN cells of the indicated mice. Each set of paired samples represents an independent experiment. d. Left panel, frozen axillary LN sections of indicated mice were stained with antibodies specific for Lyve-1, and PD-L1. Right panel, summary plot of PD-L1 MFI of Lyve-1+ pixels in the indicated LN location. Data are represented as mean +/− SEM. Significance values represent a comparison of the MFI of PD-L1 staining of Lyve-1+ vessels between LtβR-Ig and PBS treated mice of the indicated LN compartment. S = subcapsule C = cortex, M = medulla. Scale bar = 200 µm. e. Left panel, frozen axillary LN sections from indicated mice were stained with antibodies specific for Lyve-1 and MAdCAM-1. Scale bar = 200 µm. Right panel, summary plot of MAdCAM-1 MFI of Lyve-1+ pixels in the LN subcapsule. Data are represented as mean +/− SEM. MFI calculated as in (c). Staining is representative of multiple fields from 3 independent experiments consisting of 2 separate LN from 3 mice. *p<0.05, **p<0.01, ***p<0.001, ns = not significant.

