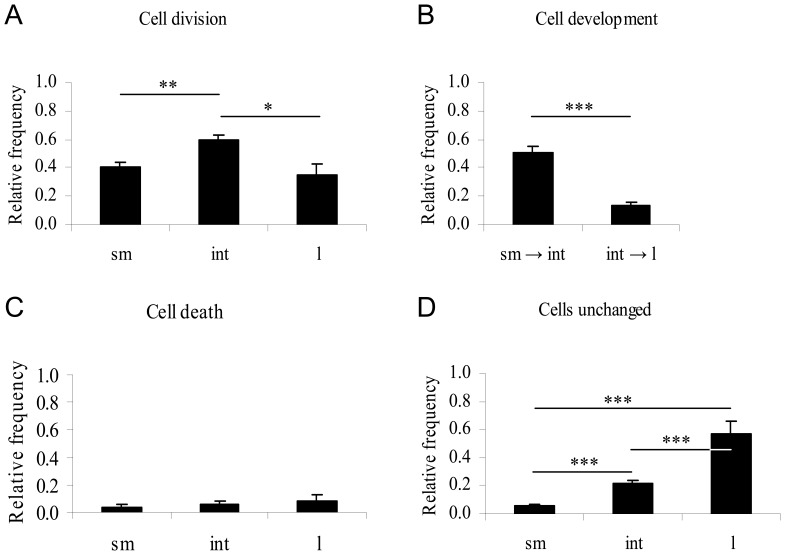
Figure 4. Morphological data analysis of MUG-Chor1 cells.
Cells were tracked over a period of seven days with images taken every 30-vacuolated cells (n = 175; sm), intermediate cells containing at least one vacuole (n = 209; int), and large cells containing an estimated total vacuole compartment at least the size of the nucleus (n = 35; l). Cells leaving or entering the monitored areas or undergoing cell division at the very beginning or end of the time lapse were excluded from investigation. A) Intermediate cells significantly divided at a higher rate than small or large cells whereas no difference was seen between small and large cells (p = 0.57). B) Development of small into intermediate cells was significantly higher than intermediate to large cells. No backward-development was detected. C) Cell death rates did not differ significantly. D) The fraction of cells remaining in their phenotype without developing or dividing was found to be highest in large physaliferous cells followed by intermediate and small cells. p-Values as indicated by asterisks: p<0.01 (*); p<0.001 (**), p<0.0001 (***).

