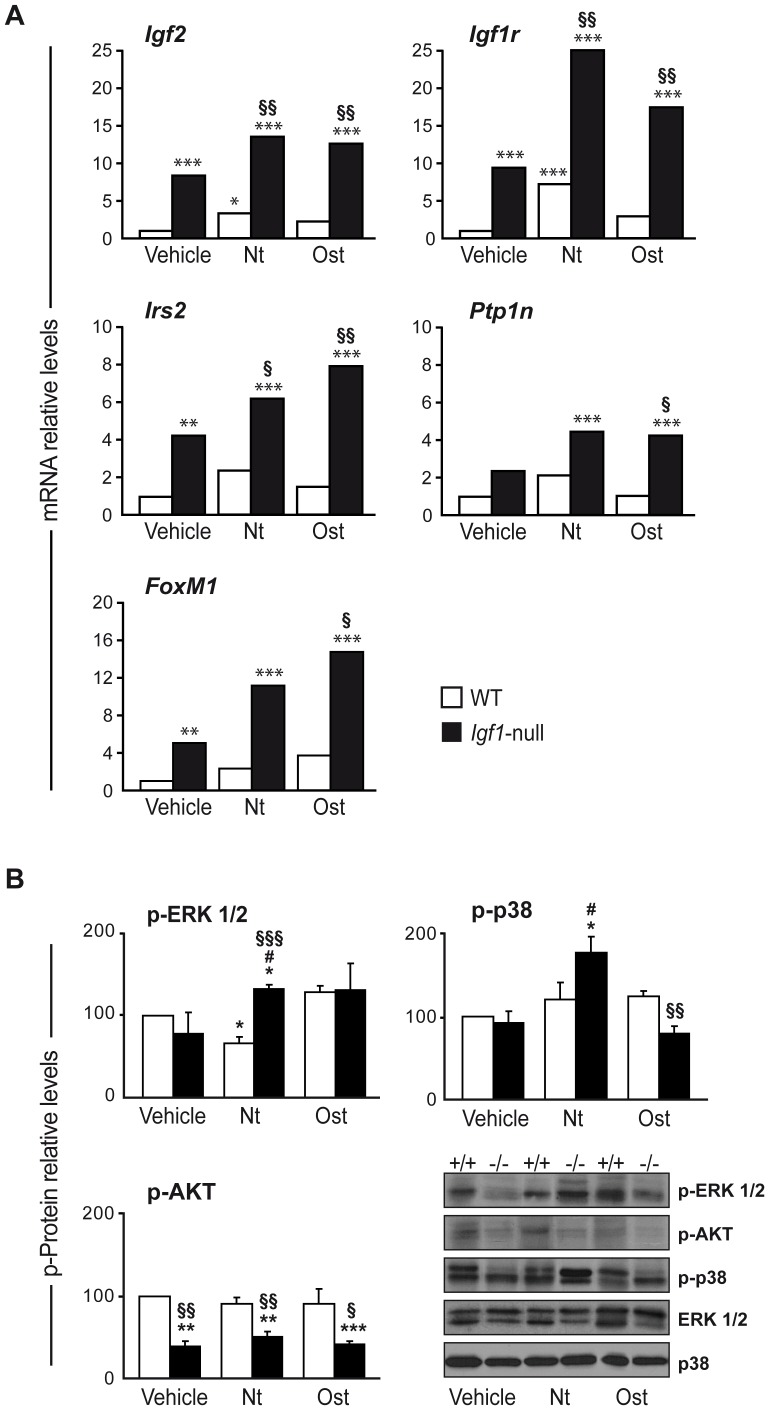
Figure 6. IGF system and signalling targets in bone of wild type and Igf1-null mice with or without PTHrP treatment.
(A) Gene expression levels of Igf2, Igf1r, Irs2, Ptpn1 and FoxM1 were determined by real time PCR in wild type (WT; white bars) and Igf1-null (black bars) mice, treated with either PTHrP (1–36) (Nt), osteostatin (Ost) or saline vehicle. Rplp0 expression levels were used as endogenous housekeeping control gene. Data correspond to 2 males and 3 females for PTHrP-treated mice or 3 males and 2 females for vehicle-treated mice of each genotype, respectively, and were calculated as log10RQ and represented as relative levels over corresponding WT-vehicle value in each case. Adjusted p-values were calculated with StatMiner software, and were considered significant when p<0.05. (B) Levels of p-ERK1/2, p-AKT and p-p38α were measured by Western blotting in protein extracts from the tibiae of individual wild type and Igf1-null mice, treated or not with Nt or Ost. Blots were reprobed for total ERK1/2 or p38α as loading controls. Symbols are: +/+, WT mice; −/−, Igf1-null mice. Densitometry values are shown as mean ± SEM corresponding to 2 males and 1 female for PTHrP- or vehicle-treated mice of each genotype, respectively. These values corresponding to vehicle-WT mice were: 0.68±0.07, 0.82±0.05 and 0.62±0.10 for p-ERK1/2, p-AKT and p-p38α, respectively, and were normalized to 100 in each case in the Figure. Statistical significance was estimated by ANOVA and p<0.05 was considered significant. *p<0.05, **p<0.01, ***p<0.001 vs vehicle-treated WT value; #p<0.05 vs vehicle-treated Igf1-null mice; §p<0.05, §§p<0.01, §§§p<0.001 vs same treatment in WT mice.

