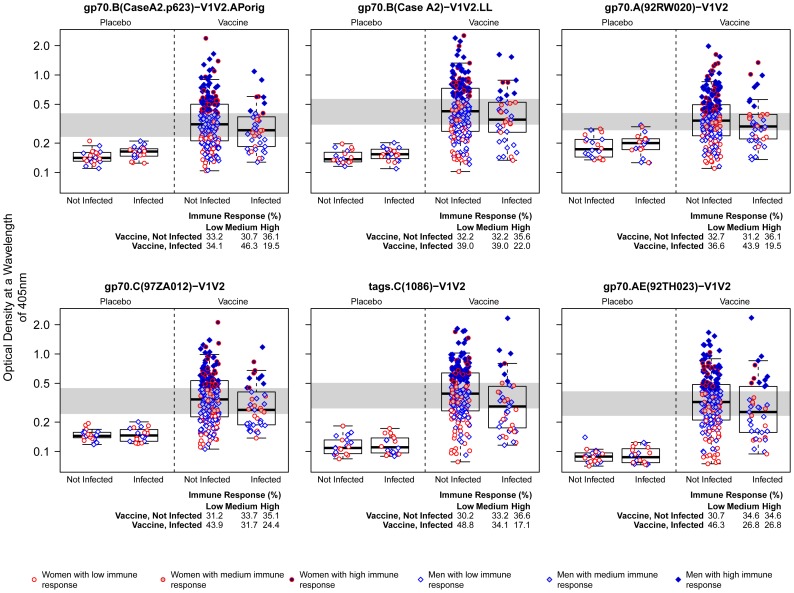
Figure 6. Reactivity in ELISA of V1V2-scaffold antigens with plasma from Week 26 case-control specimens.
Results are shown as box plots of reactivity with each of the six V1V2-scaffold antigens with plasma from the 286 case-control specimens. Values are from ELISA-generated data with optical density (OD) read-outs based on a wavelength of 405 nM. Data were generated using plasma diluted 1∶100, except for assay of gp70.AE(92TH023)-V1V2 (1∶900) and tags.C(1086)-V1V2 (1∶300). Box plots show the 25th percentile (lower edge of the box), 50th percentile (horizontal line in the box), and 75th percentile (upper edge of the box). Participants are stratified according to HIV-1 infection status and treatment assignment. Gender and immune response categories are indicated by the color and shape of the points. Low, Medium, and High are defined as tertiles of the Week 26 immune response for the vaccine group, and are divided by the gray shaded horizontal bands. AP and LL denote production of comparable reagents by Drs. Pinter and Liao.

