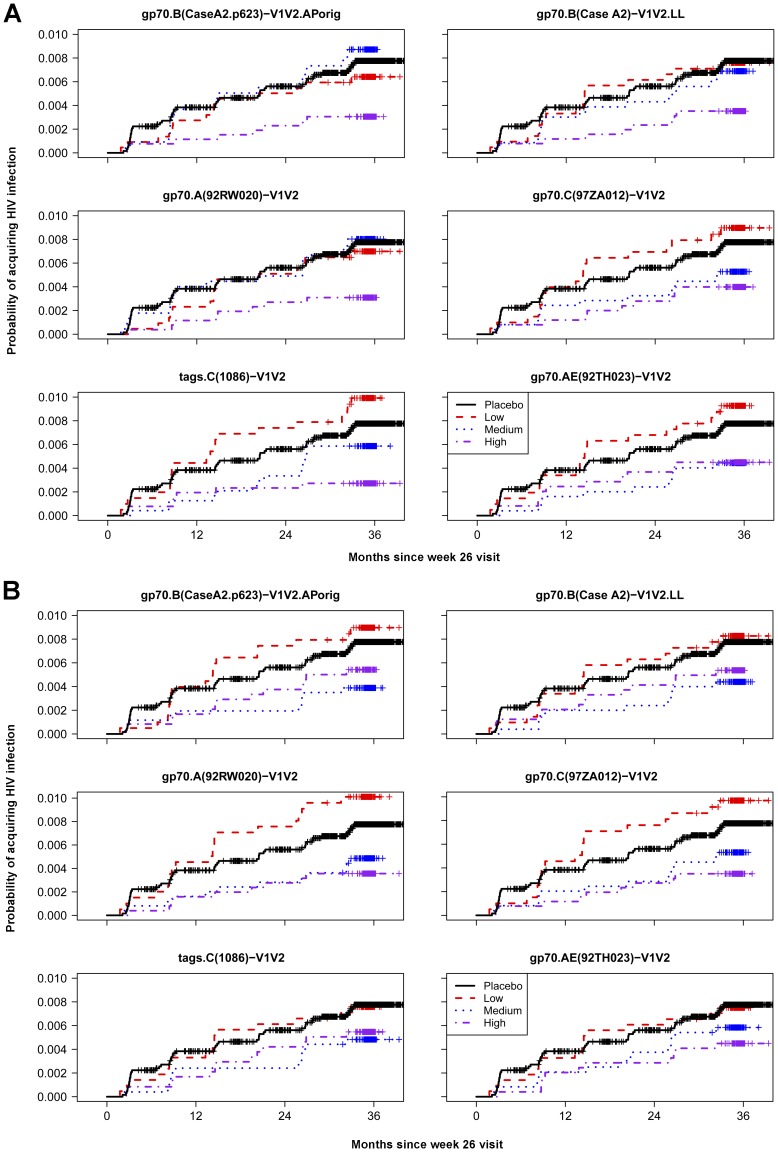
Figure 8. Estimated cumulative incidences of HIV-1 infection in placebo and vaccine recipients.
The probability of acquiring HIV infection in vaccine recipients is shown for vaccine recipients with Low, Medium and High V1V2-scaffold IgG Ab responses as measured (A) by ELISA and (B) by BAMA at Week 26. The x-axis shows months since the Week 26 visit (two weeks post last immunization) and the y-axis shows the estimated probability of acquiring HIV-1 infection.

