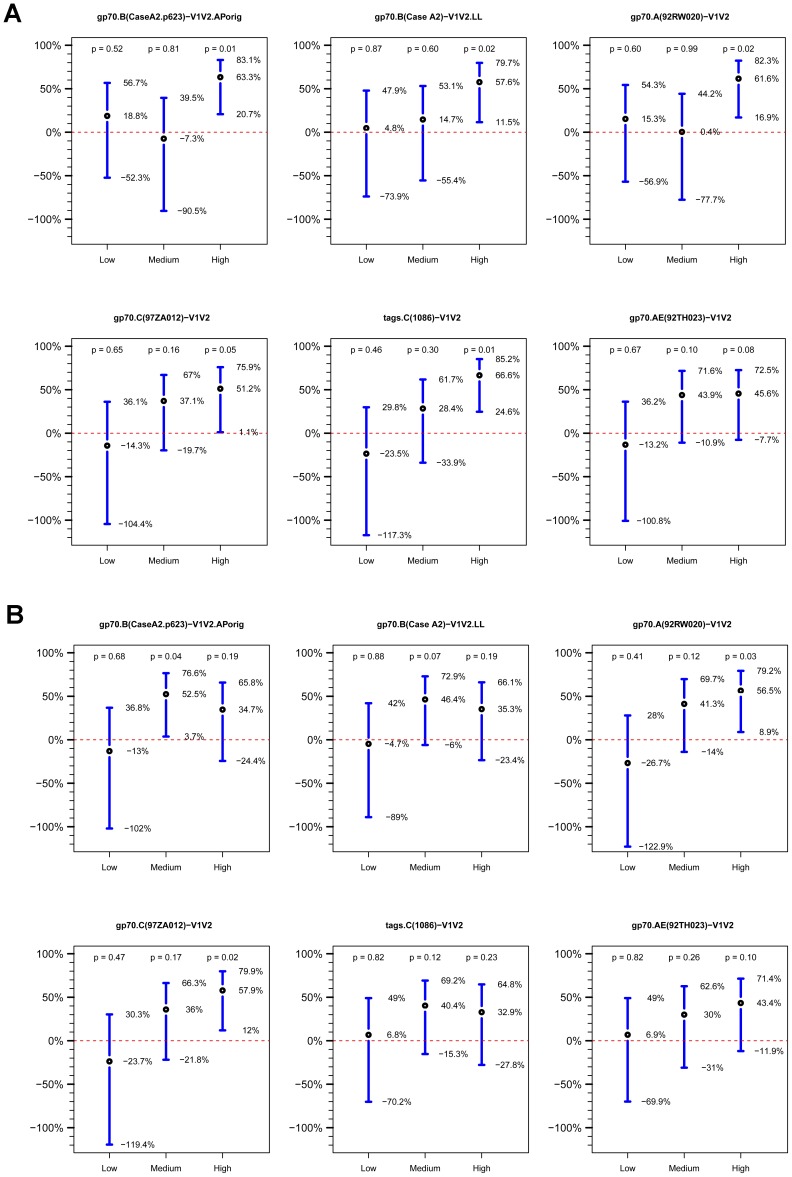
Figure 9. Estimated vaccine efficacy (VE).
Estimated VE is shown for vaccine recipients with Low, Medium and High V1V2-scaffold IgG Ab responses at Week 26 versus the placebo group as defined by (A) ELISA data, and (B) BAMA data. VE is estimated as one minus the odds of infection in vaccine recipients with Low/Medium/High responses divided by the odds of infection in the entire HIV-1 negative placebo group at week 24. Points show the estimated VE values, and vertical lines delineate 95% confidence intervals. Two-sided p-values are from Wald tests.

