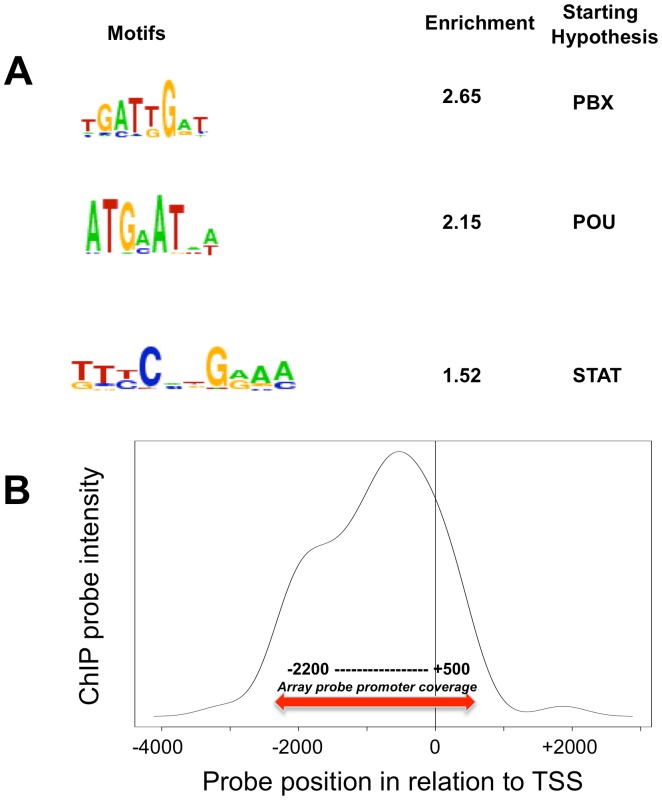
Figure 1. E2A-PBX1 ChIP binding.
A. Peak promoter sequence analysis. Chromatin immunoprecipitation assays were performed to identify direct targets E2A-PBX1 using the human promoter array; HG18; (NCBI Build 36, Roche Nimblegen, Madison WI). A search was performed using the software WebMOTIFS and de novo motif finding a search for Transcription Factors that are likely to contact and regulate the binding sites identified by ChIP-chip. The 3 most significant transcription factor families (classes of transcription factors most likely to regulate the input sequences) are PBX, POU and STAT. B. Positional binding of E2A-PBX1. Among the 108 top hit ChIP genes, 76 genes have a single annotated transcription start site. The average intensity of ChIP pull-down is graphed along the promoter region in a smoothed plot. This histogram of the positions of maximal peak intensities (mean of 3 replicates) relative to the transcription start site (TSS) in target genes (Table S3). Most target genes show a maximum probe intensity around −500 bp upstream of the TSS. Probe regions with multiple TSS were excluded from this analysis. The promoter coverage area was complete for all genes between −2200 and +500 by the TSS (solid line) with some additional coverage for some genes outside of that region (dotted line).

