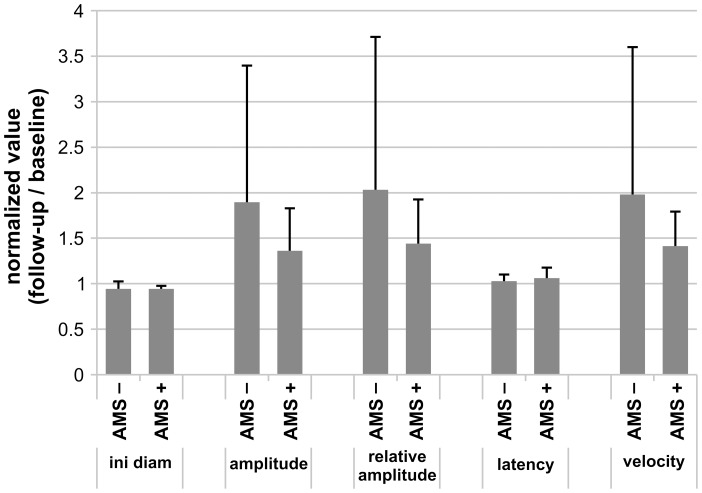
Figure 3. Pupil changes in the subgroups of AMS+ and AMS− at high altitude.
Bar graphs represent intraindividual changes in pupil parameters (expressed as normalized values to the baseline measurements before exposure, BL1) of the AMS+ respectively AMS− group on day2. Displayed are the changes in initial diameter, amplitude, relative amplitude, latency and contraction velocity. Data are depicted as mean normalized value ± SD; number of subjects: n = 7 for AMS+ and AMS− group.

